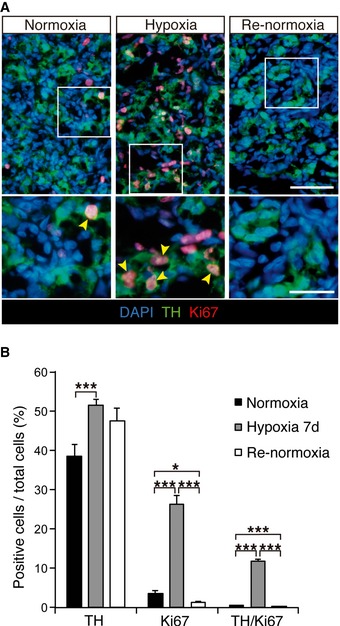
Figure EV1. Proliferation of CB TH‐positive glomus cells in response to hypoxia.

- Immunohistochemical detection of TH (green) and Ki67 (red) in carotid body (CB) of normoxic, hypoxic (7d), and re‐normoxic rats (7d).
- Percentage of positive cells versus total cells for the indicated markers in the three experimental groups of animals shown in (A) (n = 2–3 rats per group).
Source data are available online for this figure.
