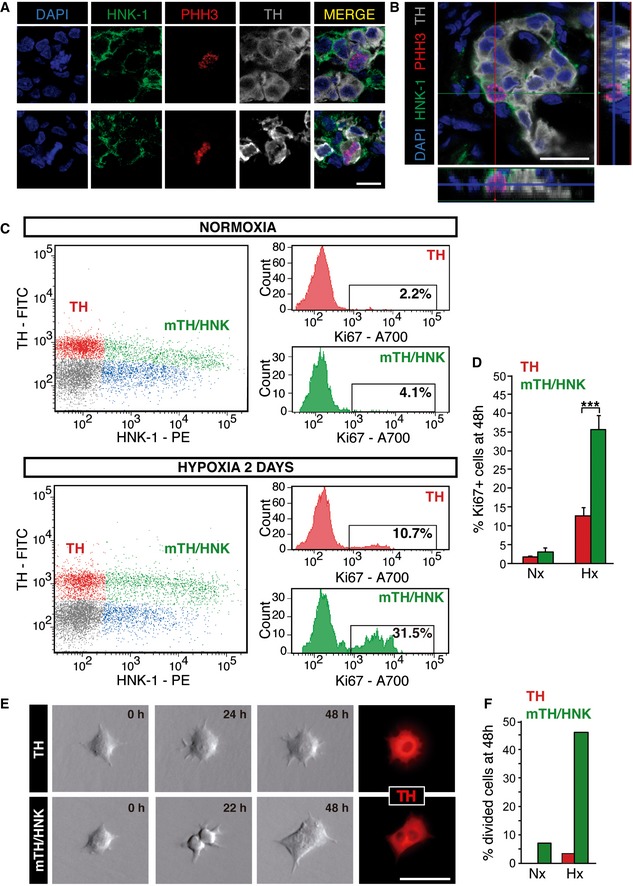
Figure 2. HNK‐1 specifically labels proliferating TH‐positive CB cells.

-
A, BImmunohistochemical analysis of CB from rats exposed to hypoxia for 48 h, illustrating the membrane expression of the glycoepitope HNK‐1 in PHH3+ proliferating CB neuronal (TH+) cells.
-
CFlow cytometry analysis of normoxic and 2d hypoxic CBs, with membrane staining of the cells with antibodies against HNK‐1 and intracellular staining with antibodies against TH and Ki67. Note that upon exposure to hypoxia proliferation (Ki67+) is particularly increased in the HNK‐1+ subpopulation of neuronal (TH+) cells.
-
DQuantification of proliferating cells in flow cytometry plots as those shown in (C) (n = 5 normoxic, Nx, and 6 hypoxic, Hx, rats).
-
ETime‐lapse video microscopy imaging of TH+ and mTH+/HNK‐1+ CB cells, sorted alive by flow cytometry (see Fig EV2). After 48 h recording, most cell division activity was observed in the HNK‐1+ subpopulation.
-
FQuantification of cell divisions observed after 48 h using time‐lapse microscopy, confirming that proliferation is a feature of HNK‐1+ CB neuronal cells [n = 42 TH+ and 42 mTH+/HNK+ cells exposed to normoxia (Nx; n = 3 rats), and 96 TH+ and 89 TH+/HNK+ cells exposed to hypoxia (Hx; n = 5 rats)].
