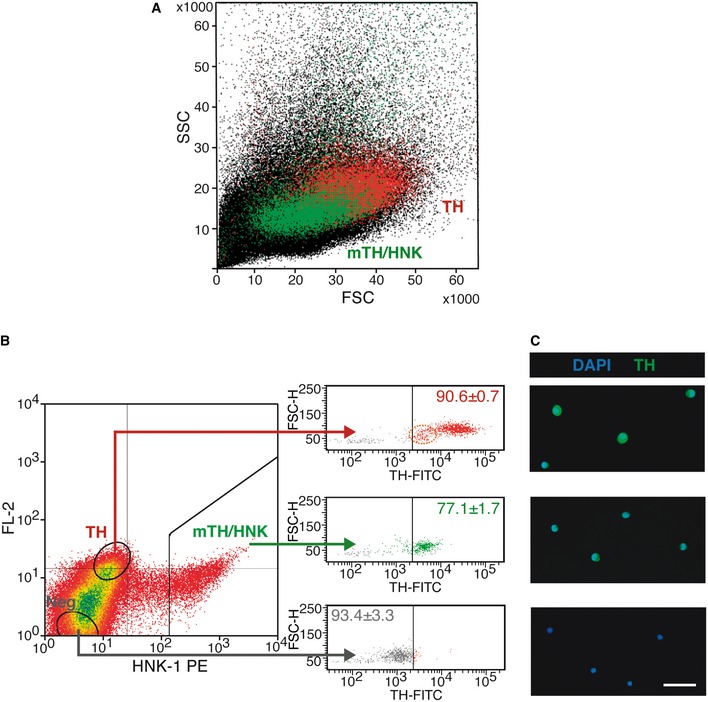
Figure EV2. Enrichment and sorting of live mature and immature CB glomus cells.

- Forward (FSC) versus side (SSC) scatter plot of CB dispersed cells, illustrating the difference in size and complexity between mature (TH, red dots) and immature (mTH/HNK, green dots) CB glomus cells.
- FACS plot representing HNK‐1 staining versus FL‐2 channel autofluorescence, with sorting gates to enrich as mature (TH; which are HNK− and autofluorescent) and immature (mTH/HNK; which are HNK+) CB glomus cells. Bulk CB‐negative (Neg) cells are also sorted as a control. The right panel shows TH expression in the different sorted cells, as revealed by intracellular staining of fixed cells, confirming the nature of the different sorted populations. The percentages inside the plots refer to the proportion of cells within that particular side of the plot with regard to TH expression (n = 3 independent experiments with a total of 11 rats). Note the presence of a small subpopulation of TH low/HNK‐1‐negative cells (dashed orange ellipse in the upper right panel), which might constitute neuroblasts that lost HNK‐1 expression due to tissue dispersion, or a subpopulation of intermediate cells between neuroblasts and mature glomus cells. In the last case, these cells might account for the basal proliferation observed in the TH+ population (see Fig 2C).
- Microscopy images of the different sorted cells shown in (B), confirming their differential expression of the neuronal marker TH. Scale bar: 25 μm.
Source data are available online for this figure.
