
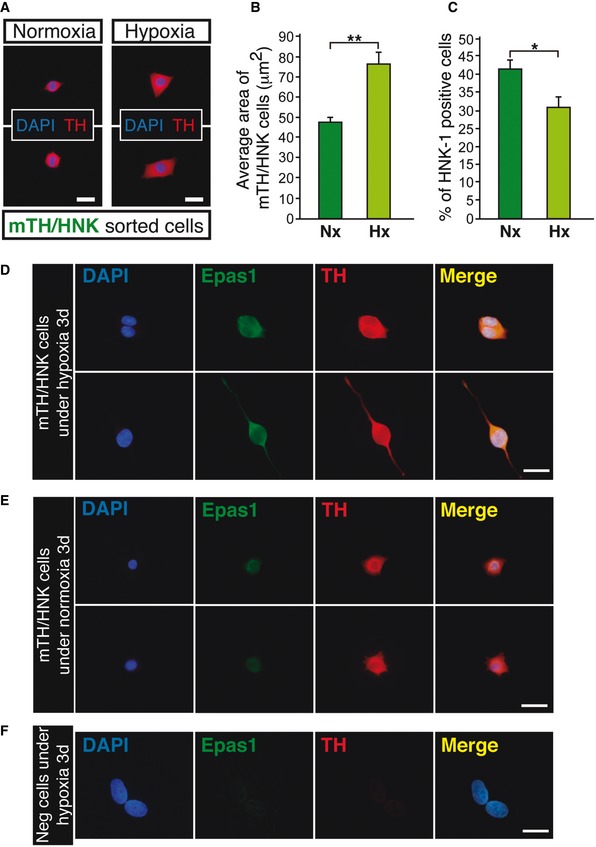
Figure EV3. Maturation of mTH/HNK cells under hypoxia entails an increase in cell size and a decrease in HNK‐1 expression levels, with stabilization of Hif2α.
-
AImmunofluorescent images showing detection of tyrosine hydroxylase (TH; red) in mTH/HNK sorted cells from carotid bodies of normoxic rats. Cells were cultured on adherent substrate either in normoxic conditions (21% O2; Normoxia) or in hypoxic conditions (3% O2; Hypoxia) for 4 days.
-
BQuantification of cell size from the experiment shown in (A) (n = 191 cells from three independent cultures with a total of 12 rats).
-
CQuantification of the percentage of HNK‐1‐positive cells from the experiment shown in (A). The data show a clear decrease in the number of HNK‐1‐positive cells in cultures exposed to hypoxia (n = 182 cells from three independent cultures with a total of 12 rats).
-
D–FImmunocytochemical pictures showing stabilization of Hif2α (Epas1) in mTH/HNK sorted cells after 3 days cultured in hypoxic conditions (3% O2) (D), as compared to normoxic conditions (21% O2) (E). Pictures were taken in parallel, with the same exposure time and conditions, in order to see the differences in Epas1 and TH staining intensities between normoxia and hypoxia. Negative cells (sorted as shown in Fig EV2B), cultured in parallel conditions, are not stained by the anti‐Epas1 antibody (F).
Source data are available online for this figure.