-
A
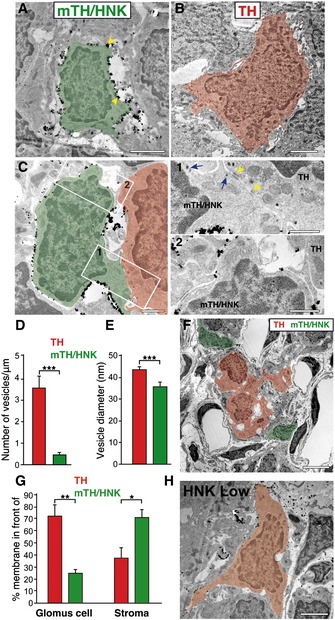
Electron micrograph of a normoxic CB section after immunostaining with gold particles against HNK‐1 expression. A typical HNK‐1+ cell (mTH/HNK) is depicted in green pseudocoloring, with gold particles present all around its plasma membrane (yellow arrowheads). Scale bar: 2 μm.
-
B
Electron micrograph showing a typical mature CB glomus cell (TH) in red pseudocoloring, which is negative for the HNK‐1 staining. Note how the HNK‐1+ cell shown in (A) is smaller in size and has a thinner cytoplasm than the mature glomus cell shown in (B). Scale bar: 2 μm.
-
C
Detail of an HNK‐1+ immature neuroblast (green) in close proximity to a mature glomus cell (red). The areas of cell‐to‐cell contact have been boxed and augmented in (1) and (2). Electron‐dense areas of contact can be observed (yellow arrowhead), and an increased number of larger secretory vesicles can also be detected in the mature glomus cell. Often, prolongations of third cellular elements, as shown in (2), can be observed in between the two types of cells. Scale bars: 1 μm.
-
D, E
Quantification of the number of vesicles per membrane unit length, and the size of vesicles, in both mature glomus cells (TH) and HNK‐1+ immature neuroblasts (mTH/HNK) (n = 31 mature and 33 immature neuronal cells from three different normoxic rats).
-
F
Low magnification electron micrograph of a normoxic CB stained for HNK‐1 expression, with positive cells (mTH/HNK neuroblasts) in green pseudocoloring and negative glomus cells (TH) pseudocolored in red, to highlight the typical peripheral location of HNK‐1+ neuroblasts within CB glomeruli. Scale bar: 5 μm.
-
G
Quantification of the percentage of membrane surface from TH cells (red bars) or mTH/HNK cells (green bars) located in front of a glomus cell (TH cell) or in front of cell‐free stroma. TH cells show a great percentage of their membrane in front of other TH cells (72.6% of the TH cell surface; measured in nine cells from three animals), as expected by their location inside the glomerulus. However, mTH/HNK cell surface is mostly in front of cell‐free stroma, compatible with a peripheral position of these cells within the glomeruli (n = 5 cells from three different rats).
-
H
Electron micrograph of a carotid body section from a normoxic rat after immunostaining with gold particles against HNK‐1 expression. The image shows a typical cell (pseudocolored in orange) that presents low levels of the HNK‐1 marker. Scale bar: 2 μm.
Data information: Data in bar graphs are presented as mean ± SEM. *
‐test).

