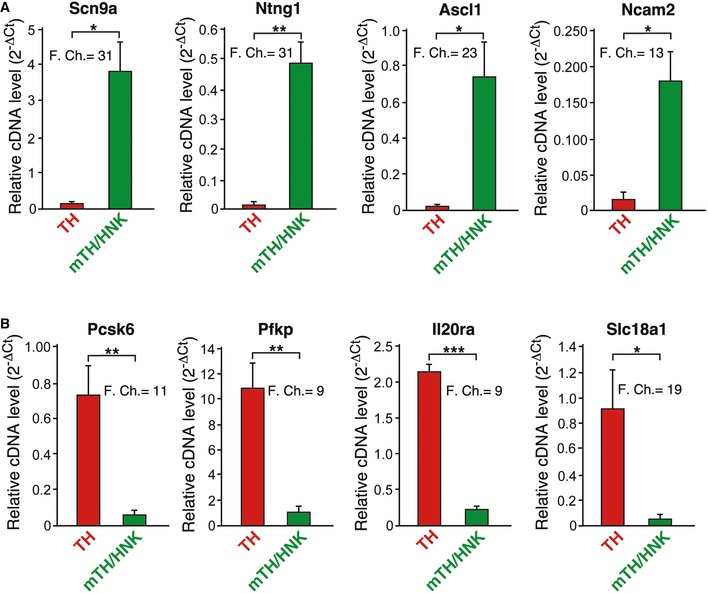
Figure EV4. Differential gene expression between TH and mTH/HNK cells.

- Graphs showing relative cDNA levels, as a measure of mRNA, and fold changes of genes preferentially expressed in mTH/HNK cells. These cells show upregulation in some genes typically expressed in neuroblastic and immature cells, such as Ascl1, Ncam2, Scn9a, and Ntng1 (n = 3 independent mRNA samples from four animals each).
- Graphs showing relative cDNA levels, as a measure of mRNA, and fold changes of genes preferentially expressed in TH cells. These cells display a typical neuroendocrine mature cell profile, with high expression of genes related to transport of vesicles and signaling, such as Slc18a1 and Il20ra, and genes related to metabolism, such as Pfkp. Interestingly, Pcsk6, which encodes for a negative regulator of Ascl1, is also upregulated 27, (n = 3 independent mRNA samples from four animals each).
Source data are available online for this figure.
