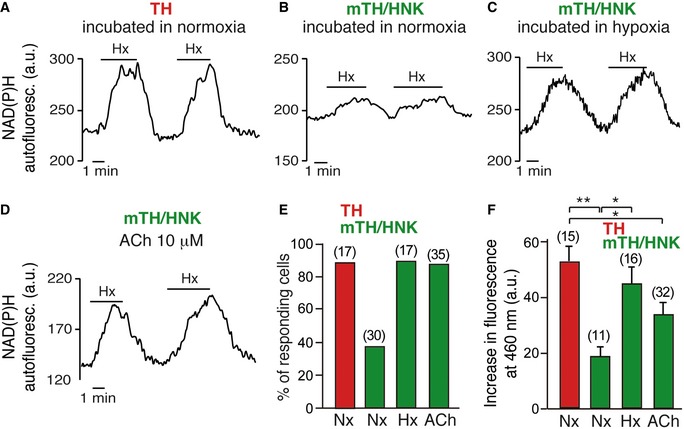
Figure EV5. Hypoxia and cholinergic signaling induce neuroblast maturation.

-
A–DIncrease in NAD(P)H autofluorescence in response to hypoxia in mature glomus cells (TH) after 24–48 h in normoxia (A), in immature neuroblasts (mTH/HNK) after 24–48 h in normoxia (B), in immature neuroblasts after 24–48 h in hypoxia (C), and in immature neuroblasts after exposure to acetylcholine (ACh) for 24–48 h (D).
-
EQuantification of hypoxia‐responsive cells, as measured by NAD(P)H autofluorescence, under the indicated conditions. Number of total cells studied is indicated between brackets.
-
FQuantification of the magnitude of the response to hypoxia in the different cells under the indicated conditions. Number of total cells studied is indicated between brackets.
Source data are available online for this figure.
