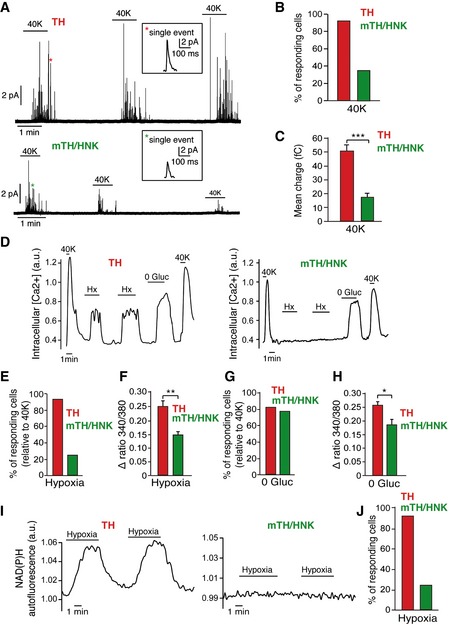
Amperometric recordings of single exocytotic events from mature glomus cells (TH) or neuroblasts (mTH/HNK) in response to depolarization by extracellular solution containing high potassium. Single vesicle fusion events are shown in the insets.
Quantification of the percentage of cells responding to high potassium as recorded by amperometry (n = 25 total TH+ cells and 26 total mTH+/HNK+ cells).
Quantification of the mean charge of single exocytotic events from both mature glomus cells (n = 266 spikes from six cells) and neuroblasts (n = 221 spikes from six cells). The smaller charge of single fusion events from mTH+/HNK+ cells confirms their immature phenotype, in agreement with the electron microscopy data.
Increases in intracellular calcium concentration in response to different stimuli, measured by changes in the fluorescence of the calcium indicator FURA‐2. Note how CB neuroblasts (mTH/HNK) are responsive to some stimuli such as hypoglycemia (0 Gluc) or high potassium (40K) but not to others such as hypoxia (Hx).
Percentage of cells responding to hypoxia (Hx) (n = 117 TH+ and 193 mTH+/HNK+ cells).
Quantification of the magnitude of the response to hypoxia in both mature glomus cells (TH; n = 108 cells) and neuroblasts (mTH/HNK; n = 48 cells).
Percentage of cells responding to hypoglycemia (0 Gluc) (n = 48 TH+ and 59 mTH+/HNK+ cells).
Quantification of the magnitude of the response to 0 Gluc in both mature glomus cells (TH; n = 42 cells) and neuroblasts (mTH/HNK; n = 47 cells).
Monitoring of NAD(P)H autofluorescence generated by mitochondria in response to hypoxia in both mature glomus cells (TH) and neuroblasts (mTH/HNK). Note the absence of a response by neuroblasts.
Quantification of cells responding to hypoxia, as measured by recordings of NAD(P)H autofluorescence (n = 117 TH+ and 193 mTH+/HNK+ cells).
Data information: Data in bar graphs of panels (B), (E), (G), and (J) are presented as the sum of responding cells among total cells studied. Data in bar graphs of panels (C), (F), and (H) are presented as mean ± SEM. *
P < 0.05, **
P < 0.01, ***
P < 0.001 (Student's
t‐test). 40K = 40 mM extracellular potassium chloride. Cells used for the analysis in panels (A), (B), (C), (I), and (J) were obtained in four independent experiments with three rats each. Cells used for the analysis in panels (D), (E), (F), (G), and (H) were obtained in four independent experiments with a total of 13 rats.
Source data are available online for this figure.

