Figure 3.
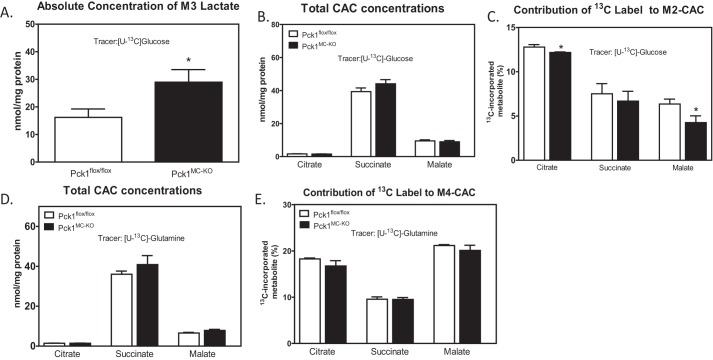
Contribution of glucose to central metabolism of LPS-activated macrophages. A–C, BMDMs isolated from Pck1flox/flox and Pck1MC-KO mice were incubated with [U-13C]glucose in the presence of LPS for 16 h and GC-MS was performed for absolute concentration of M3 lactate (A), total concentrations of CAC (B), and contribution of 13C to M2-CAC (C). D and E, BMDMs isolated from Pck1flox/flox and Pck1MC-KO mice were incubated with [U-13C]glutamine in the presence of LPS for 16 h and GC-MS was performed for total CAC concentrations (D) and contribution of 13C label to M4-CAC (E). Values represent the mean ± S.E. for n = 6 per group. *, p < 0.05 compared with Pck1flox/flox group.

