
Figure 1.
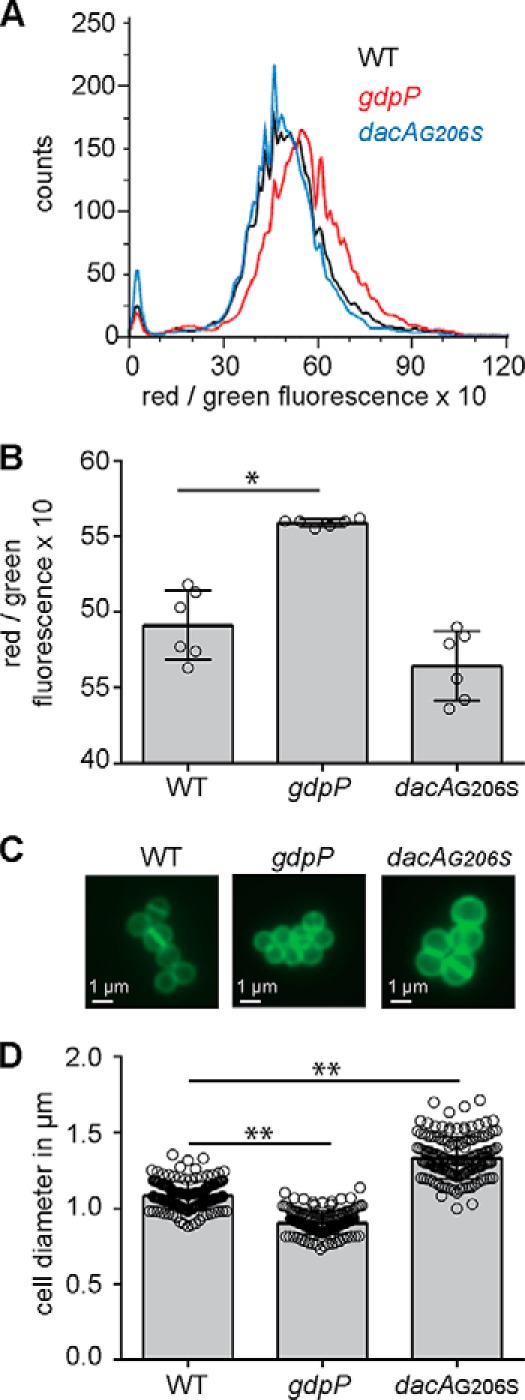
Variations in c-di-AMP levels impact the membrane potential and size of S. aureus cells. A and B, membrane potential measurement using a fluorescence-activated cell sorting-based method. WT LAC* as well as the high c-di-AMP gdpP and low c-di-AMP dacAG206S mutant strains were grown overnight in TSB medium. Cells were washed and mixed with DiOC2(3) and the green and red fluorescence intensities detected using a FACSCalibur cytometer. The fluorescence intensities of 10,000 gated events were recorded at the height of their emission peak. The ratio of red/green fluorescence × 10 was calculated for each event using the FlowJo V7 software, and representative histograms of cell counts versus fluorescence ratio are shown (A). B, mean values of red/green fluorescence × 10 were determined from the histograms in A, and the averages and standard deviations from six biological replicates were plotted. C and D, bacterial cell size determination by microscopy. WT, gdpP, and dacAG206S mutant strains were grown overnight in TSB medium. Culture aliquots were stained with vancomycin-BODIPY, and cells were imaged using a fluorescence microscope. C, representative images of WT, gdpP, and dacAG206S cells are shown. D, bacterial cell diameters were determined by drawing a line through the middle of non-dividing cells using ImageJ. 150 cells were measured (three biological replicates with 50 cells each), and the average cell diameters in micrometers and standard deviations were plotted. Statistical analysis was performed in Prism (GraphPad) using a Kruskal-Wallis test followed by a Dunn's multiple comparison test. Adjusted p values <0.05 are indicated by a single asterisk and adjusted p values < 0.01 by a double asterisk.