
Figure 8.
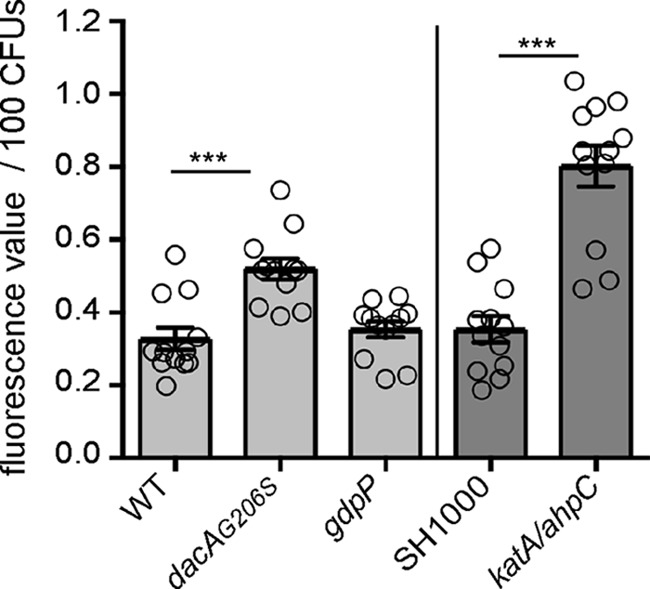
Reduced c-di-AMP levels lead to an increase in ROS production. Determination of endogenous ROS production in WT and mutant S. aureus strains is shown. LAC* (WT), the isogenic dacAG206S, and gdpP mutant strains as well as control strains SH1000 and SH1000ΔkatAΔahpC were grown to mid-log phase in TSB medium. Endogenous ROS production was determined using the indicator dye 2′,7′-dichlorofluorescein diacetate, which was used at a final concentration of 10 μm. Fluorescence values were measured at excitation and emission wavelengths of 485 and 538 nm, respectively. All fluorescent values were normalized for CFUs, and the average fluorescence values and standard deviations per 100 CFUs from 12 biological replicates were plotted. Statistical analysis was performed in Prism (GraphPad) using for the comparison of the values obtained for the WT LAC* stain with those obtained for the isogenic dacAG206S and gdpP mutant strains (light gray bars) a Kruskal-Wallis test followed by a Dunn's multiple comparison test. For the comparison of the values obtained for strains SH1000 and SH1000ΔkatAΔahpC (medium gray bars), a Mann-Whitney test was used. Statistically significant differences are indicated by asterisks with p values <0.001 indicated by a triple asterisk.