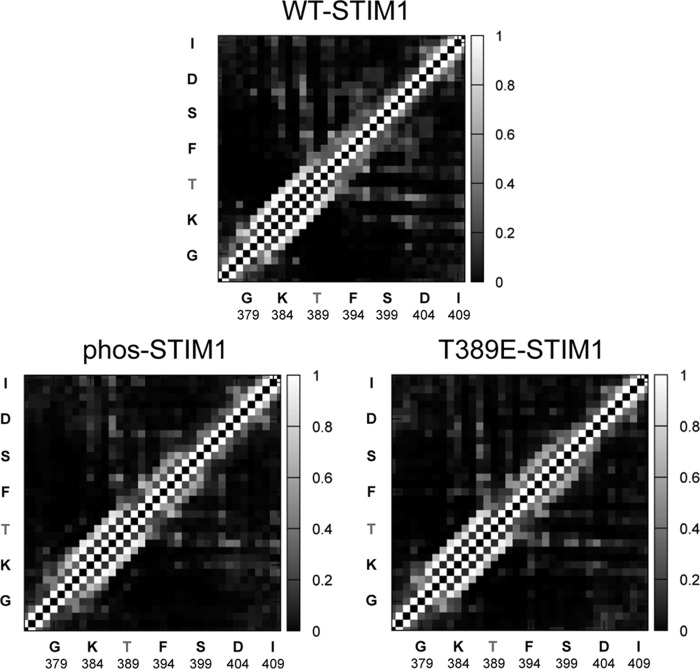
Figure 6.
Side-chain contact probability maps determined from MD simulations. The probability that a particular pair of side chains is in contact over the course of the simulation is indicated by the grayscale (lighter indicates the contact is more probable). The results are the average of results from the four replicas for each protein type. Note the increased contact probability in both the phos-STIM1 and the T389E-STIM1 data in the region spanning residues Phe394–Ser400 compared with the same region in wildtype STIM1.

