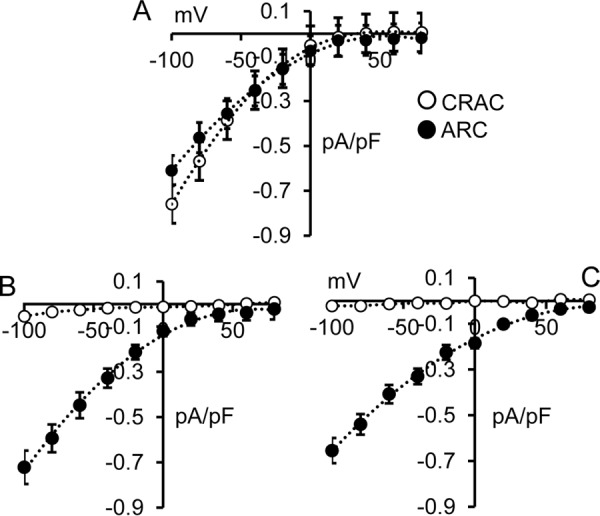
Figure 8.

A, whole-cell current–voltage relationships for both CRAC channels and ARC channels in WT cells. B, the same currents in cells bearing the G392A-STIM1 mutation. C, the same currents obtained with G392A along with the “CRAC-specific” T389A mutation. The data shown are the whole-cell adenophostin-activated CRAC channel currents (open circles) and AA-activated ARC channel currents (filled circles). Error bars represent the mean ± S.E. (n = 6–7) in each case.
