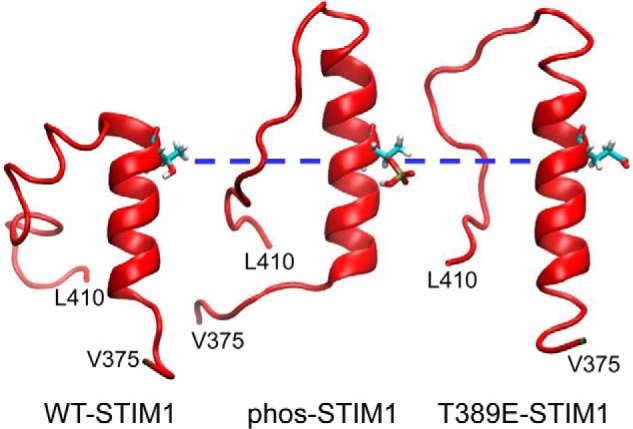
Figure 9.

Representative molecular dynamic snapshots of the STIM1 CC2 terminal helical region. The individual images demonstrate the STIM1 CC2 helical region in wildtype STIM1 and the elongation of this region upon phosphorylation of residue Thr389 (phos-STIM1) or introduction of the T389E phosphomimetic mutation (T389E-STIM1). For comparison, the three images have been aligned at the position of the Thr389 residue (blue dashed line).
