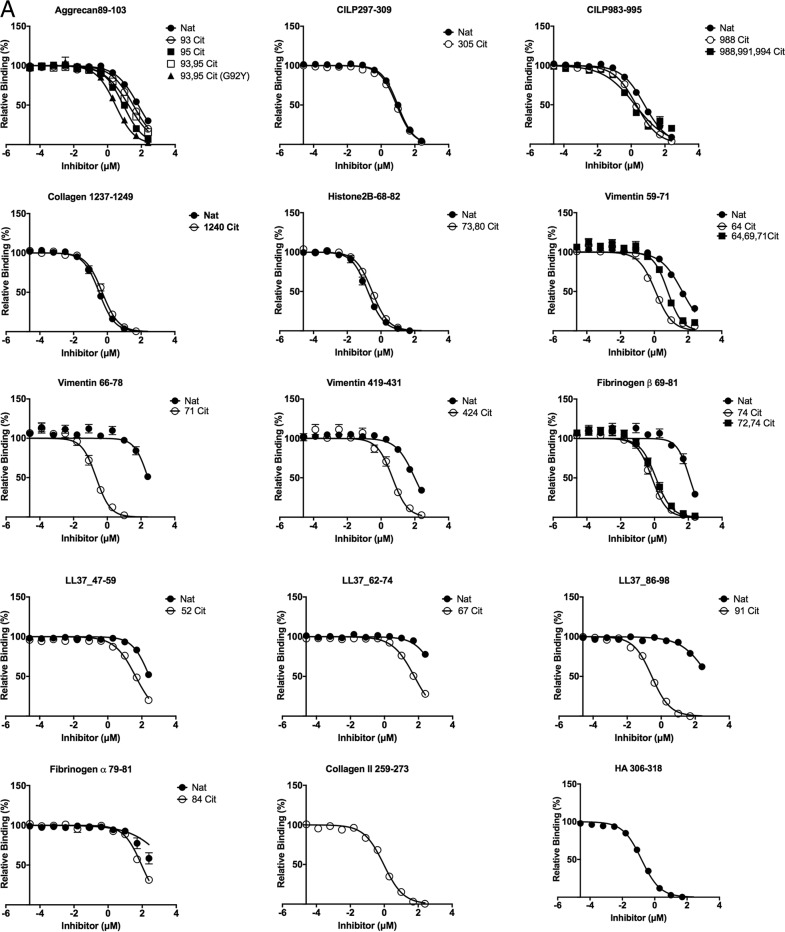
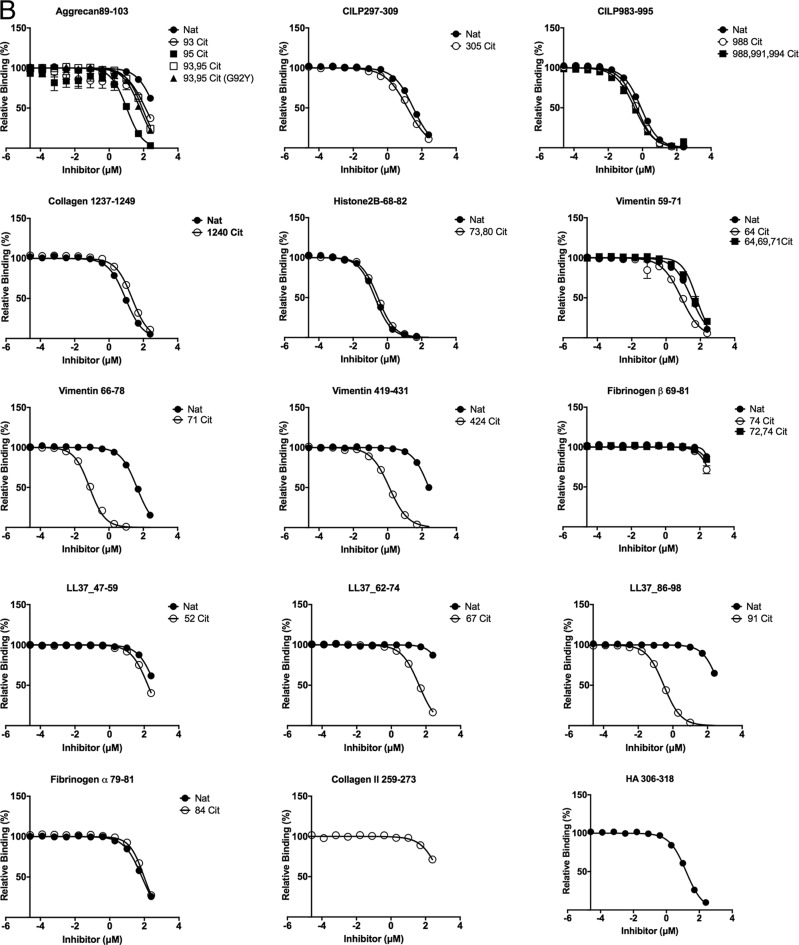
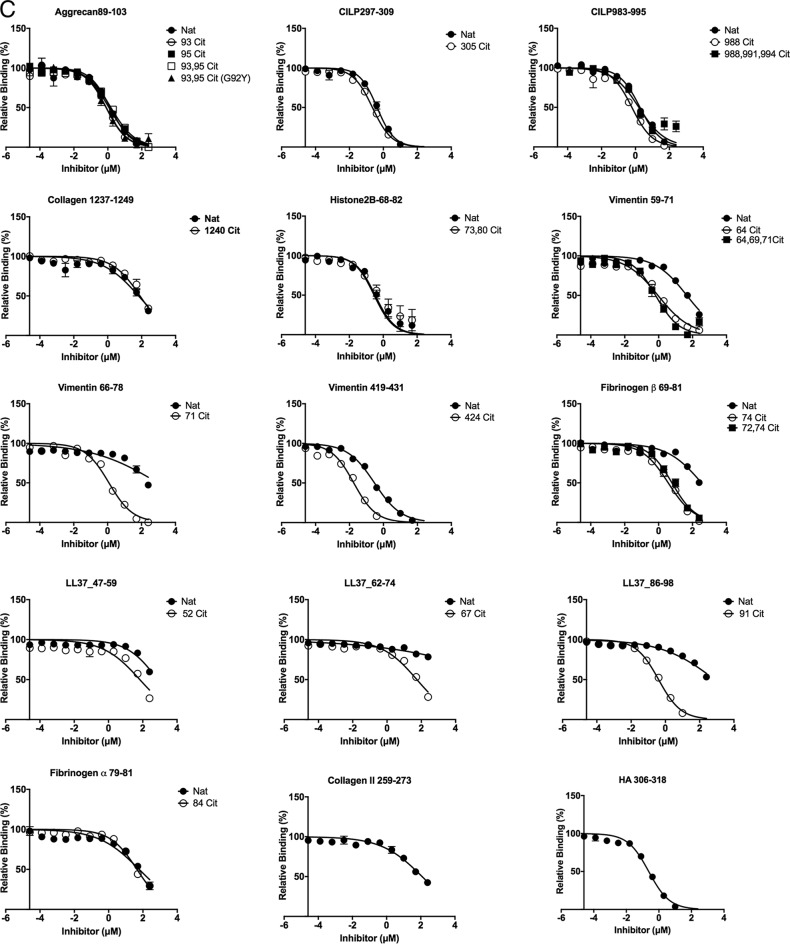
Figure 2.
Titration curve of self-peptide binding reflected by displacement of reporter fluorescent peptide in HLA-DRB1*04:01 (A), HLA-DRB1*04:04 (B), and HLA-DRB1:04:05 (C). Each data point represents normalized relative binding (in percentage) from three independent experiments. Mean values are plotted, and error bar showed SE Nat, native peptide without citrulline; Cit, citrullinated peptide. Curve fit for each set of peptides for all three allomorphs HLA-DRB1*04:01, HLA-DRB1*04:04, and HLA-DRB1:04:05 are displayed in Table S2.


