Figure 2.
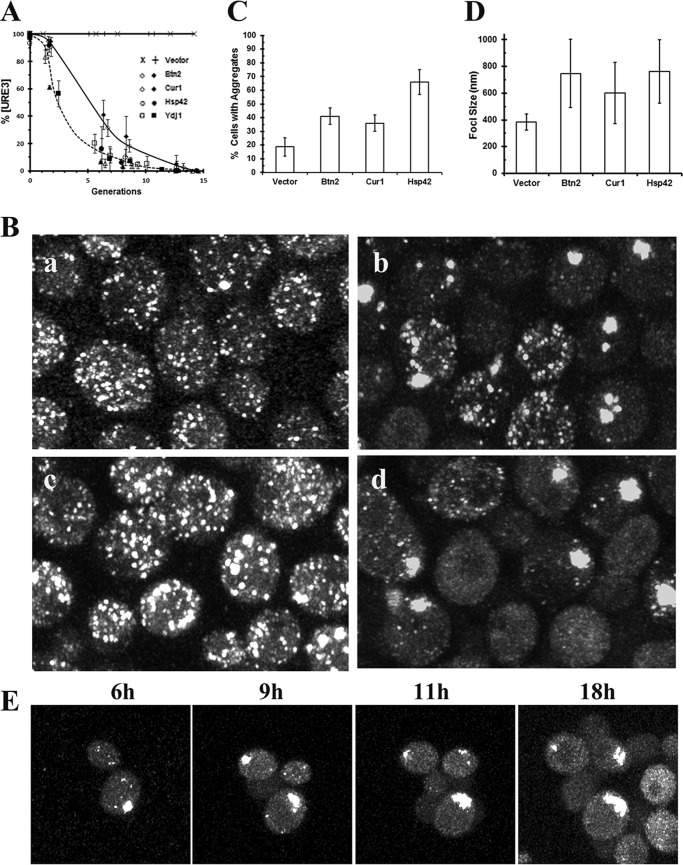
The curing of the 1660[URE3] by overexpression of Btn2, Cur1, or Hsp42. A, the curing [URE3] as a function of time was measured in the 1660 (open symbols) and 1076 (closed symbols) yeast strains overexpressing Btn2, Cur1, or Hsp42. The vector control is also shown for the 1660 (×) and 1076 (+) [URE3] strains. Yeast was grown overnight in raffinose medium prior to addition of galactose to induce expression from the GAL1 promoter. The extent of curing was measured on ½ YPD plates. The vector control was treated the same as the other samples. The data represent the averages and standard deviation obtained from three independent experiments. B, confocal images of 1660 [URE3] strain in the vector control (panel a) or in yeast overexpressing Btn2 (panel b), Cur1 (panel c), or Hsp42 (panel d). The images were taken two generations after induction of overexpression by addition of galactose on the Zeiss 880 microscope. The images are maximized projections of Z-stack confocal images. C, the percentage of cells with aggregates was measured in the vector control and in cells overexpressing the indicated proteins for two generations. For each sample, >200 cells were analyzed to determine whether they contained aggregates >0.3 μm. The values represent the averages and standard deviation. D, the average size of the aggregates was measured in the vector control and in cells overexpressing the indicated proteins for two generations. Only aggregates of >0.3 μm were measured. The values represent the averages and standard deviation (n > 150 aggregates/sample). E, images from a time-lapse movie showing formation of aggregates in the 1660 [URE3] strain overexpressing Hsp42 for the indicated time in galactose medium. Imaging was performed on the Zeiss 880 confocal microscope. The images are maximized projections of Z-stack confocal images.

