Figure 3.
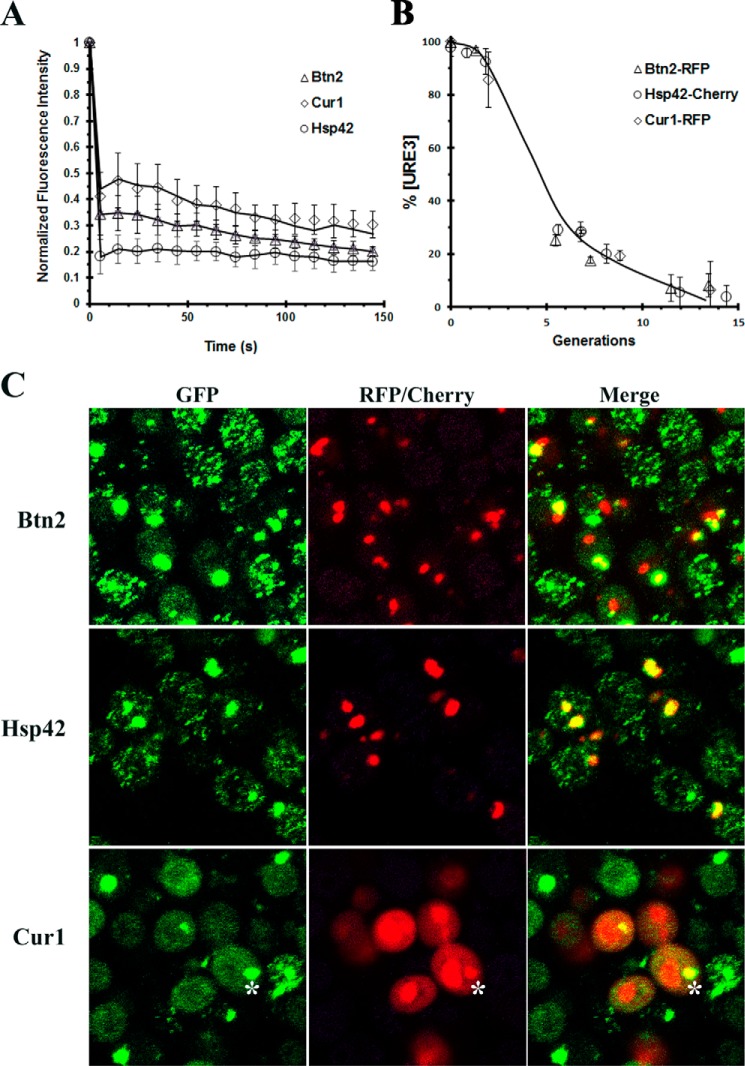
Characterization of the aggregates formed by 1660[URE3] overexpressing Btn2, Hsp42, or Cur1. A, the fluorescence recovery after photobleaching of aggregates present in 1660[URE3] yeast overexpressing Btn2, Cur1, and Hsp42. A minimum of five aggregates were photobleached for each sample on the Nikon A1R confocal microscope. The data were normalized by setting the initial fluorescence value to 1.0. The average value and a standard deviation are plotted for each time point. Photobleaching experiments were performed on the Nikon A1R confocal microscope. B, the time course of curing of 1660[URE3] by overexpression of Btn2–RFP, Cur1–RFP, and Hsp42–Cherry. The data represent the averages and standard deviation obtained from three independent experiments. C, colocalization of GFP–Ure2 with Btn2, Hsp42, and Cur1. Btn2–RFP or Hsp42–Cherry was overexpressed for two generations. Cur1–RFP was overexpressed for five generations. The asterisk shows colocalization of Ure2–GFP aggregate with Cur1–RFP. The maximum Z-stack projections of confocal images obtained on the Nikon A1R confocal microscope.

