Figure 1.
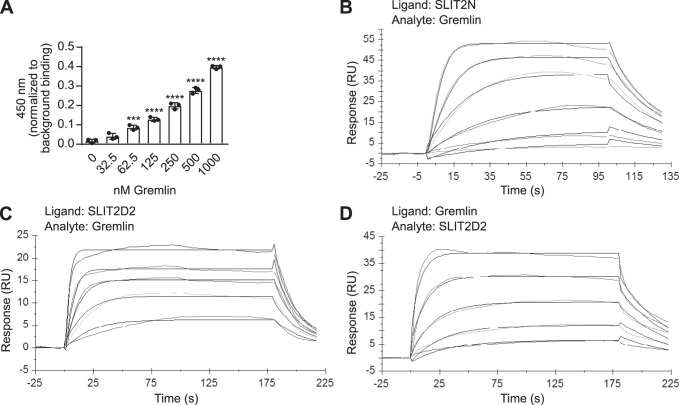
Human Gremlin binds to human SLIT2N at its second leucine-rich repeat domain. A, 45 nm biotinylated recombinant human SLIT2N (purified from 293 cells) was immobilized onto streptavidin-coated plates. The wells were blocked and incubated with increasing amounts of human Gremlin (0, 32.5, 62.5, 125, 250, 500, and 1000 nm), followed by anti-Gremlin antibody, rabbit IgG-HRP, and 3,3′,5,5′-tetramethylbenzidine substrate. The reaction was quenched with 0.18 m sulfuric acid, and binding was measured by reading the absorbance at 450 nm. Data are presented as binding minus anti-Gremlin antibody background binding. Mean ± S.D., n = 3 ***, p < 0.001, and ****, p < 0.0001, as compared with 0 nm Gremlin binding by one-way ANOVA. Data are representative of at least three independent experiments. B, representative BIAcore sensorgram displaying binding of human Gremlin (analyte in solution) to human SLIT2N coupled to an anti-human C1 chip surface (ligand). Association was monitored for 100 s, and dissociation was monitored for 30 s. Data for six concentrations of Gremlin are shown. The order of signal intensity (top to bottom) is 100, 50, 25, 12.5, 6.3, and 3.1 nm. Association and dissociation phases were fit to a 1:1 Langmuir binding model with global rate constants, global maximum capacity (Rmax), and local RI parameters. C, representative BIAcore sensorgram displaying binding of Gremlin (analyte in solution) to human SLIT2D2 coupled to an anti-human C1 chip surface (ligand). Association was monitored for 180 s, and dissociation was monitored for 30 s. Data for five concentrations of Gremlin are shown. The order of signal intensity (top to bottom) is 100, 50, 25, 12.5, and 6.3 nm. Association and dissociation phases were fit to a 1:1 Langmuir binding model with global rate constants, global Rmax, and local RI parameters. D, representative BIAcore sensorgram displaying binding of SLIT2D2 (analyte in solution) to Gremlin coupled to an anti-human C1 chip surface (ligand). Association was monitored for 180 s, and dissociation was monitored for 30 s. Data for five concentrations of SLIT2D2 are shown. The order of signal intensity (top to bottom) is 50, 25, 12.5, 6.3, and 3.1 nm. Association and dissociation phases were fit to a 1:1 Langmuir binding model with global rate constants, global Rmax, and local RI parameters. Each binding assay was performed three independent times on three independent biosensor surfaces.

