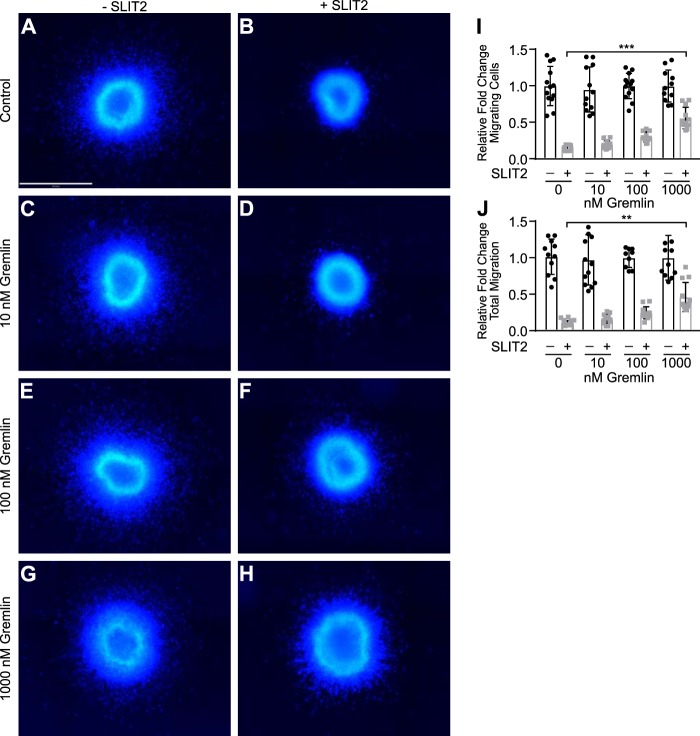
Figure 2.
Gremlin blocks SLIT2-mediated inhibition of neuronal migration in SVZa explants. Explants from rat SVZa were grown in media alone (A), 1 nm human SLIT2N (B), 10 nm Gremlin (C), 1 nm SLIT2N + 10 nm Gremlin (D), 100 nm Gremlin (E), 1 nm SLIT2N + 100 nm Gremlin (F), 1000 nm Gremlin (G), and 1 nm SLIT2N + 1000 nm Gremlin (H) for 48 h and stained with Hoechst 33342 to visualize neuronal nuclei. Scale bar represents 500 μm and applies to all images, A–H. Images were taken on the Operetta High Content Imager with a ×10 high NA objective. Fifteen fields per well with 5% overlap were taken. A Z-stack of six planes for each field was acquired with 1 μm between each plane. Images were analyzed using Volocity software. All fields in each well were stitched together. The area of the tissue explant in the center and each nucleus outside of the tissue explant were detected by Hoechst 33342 staining. I, quantification of migrating SVZa neuron cell number from A to H. Individual nuclei were counted outside the edge of the tissue explant. The total number of nuclei from each well that was not treated with SLIT2N from five individual experiments was averaged. Then the number of total nuclei from each well was divided by the average from its corresponding control group to calculate the relative fold change of the total number of migrating cells. J, quantification of migrating distance of SVZa neurons from A to H. The distance from the center of each nucleus to the closest edge of the tissue explant was measured in micrometers. The mean migration distance of nuclei in the well was multiplied by nuclei count to obtain total migration distance for each explant. The total migration from each well that was not treated with SLIT2N from five individual experiments was averaged. Then, the total migration from each well was divided by the average from its corresponding control group to calculate the relative fold change of total migration. Bar graphs represent five pooled experiments, mean ± S.D., each with n = 3. **, p < 0.01, and ***, p < 0.001, by two-way ANOVA.

