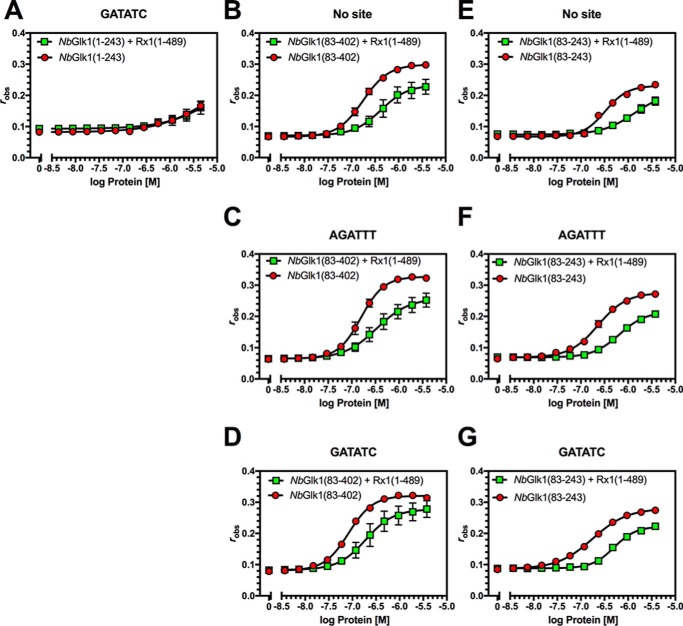
Figure 4.
Influence of Rx1(1–489) on NbGlk1 DNA binding. Fluorescence anisotropy values are plotted against log protein concentration for DNA motifs in the presence or absence of Rx1(1–489). A, NbGlk1(1–243) with the GATATC motif. B, NbGlk1(83–402) in the absence of a specific motif. C, NbGlk1(83–402) with the AGATTT motif. D, NbGlk1(83–402) with the GATATC motif. E, NbGlk1(83–243) in the absence of a specific motif. F, NbGlk1(83–243) with the AGATTT motif. G, NbGlk1(83–243) with the GATATC motif (means ± S.E.; n >3). Statistical analyses of the curves are provided in the text and Tables 1 and 2.

