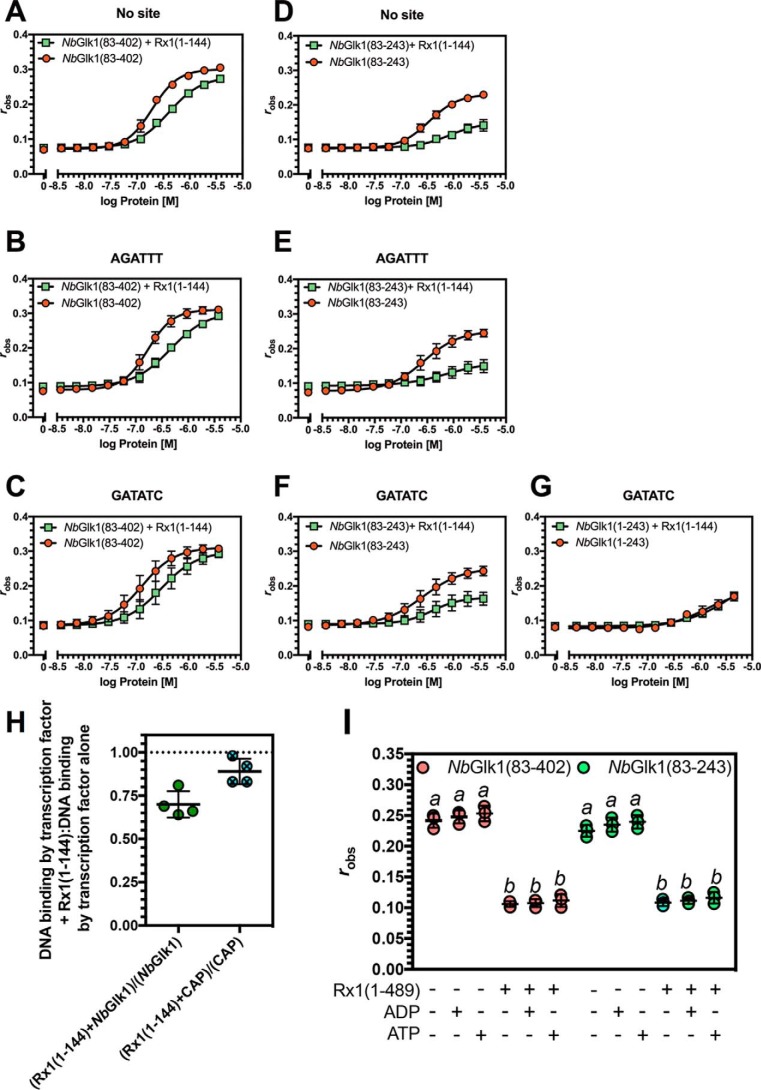
Figure 5.
Influence of Rx1(1–144) and Rx1(1–489) on NbGlk1 DNA binding. A–G shows fluorescence anisotropy values plotted against log protein concentration for varying NbGlk1 constructs binding to different DNA motifs in the presence or absence of absence of Rx1(1–144) (n = 4). A, NbGlk1(83–402) binding to DNA in the absence of a specific motif. B, NbGlk1(83–402) binding to DNA with the AGATTT motif. C, NbGlk1(83–402) binding to DNA with the GATATC motif. D, NbGlk1(83–243) binding to DNA in the absence of a specific motif. E, NbGlk1(83–243) binding to DNA with the AGATTT motif. F, NbGlk1(83–243) binding to DNA with the GATATC motif. G, NbGlk1(1–243) binding to DNA with the GATATC motif. Statistical analyses of the curves for A–G are provided in the text and Tables 1 and 2. H, ratio of fluorescence anisotropy values for 10 μm NbGlk1 or CAP binding to dsDNA with or without Rx1(1–144) (scatter plot ± S.D.). The means are significantly different (p = 0.0286, Mann-Whitney). I, DNA binding for NbGlk1(83–402) and NbGlk1(83–243) was measured in the presence or absence of 10 μm nucleotide (scatter plot ± S.D.; bars with different letters are significantly different (p < 0.05); one-way ANOVA with post hoc Holm-Sidak multiple comparison).

