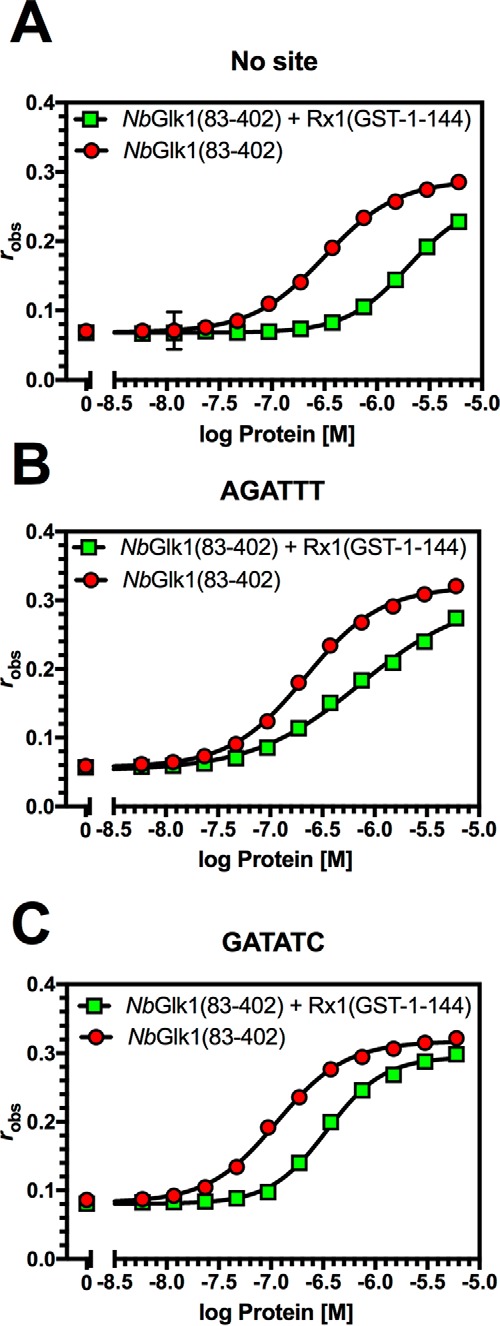
Figure 6.

Influence of Rx1(GST-1–144) on NbGlk1 DNA binding. The panels show fluorescence anisotropy values plotted against log protein concentration for NbGlk1(83–402) binding to different DNA motifs in the presence or absence of Rx1(GST-1–144) (n = 4). A, NbGlk1(83–402) binding to DNA in the absence of a specific motif. B, NbGlk1(83–402) binding to DNA with the AGATTT motif. C, NbGlk1(83–402) binding to DNA with the GATATC motif.
