Figure 4.
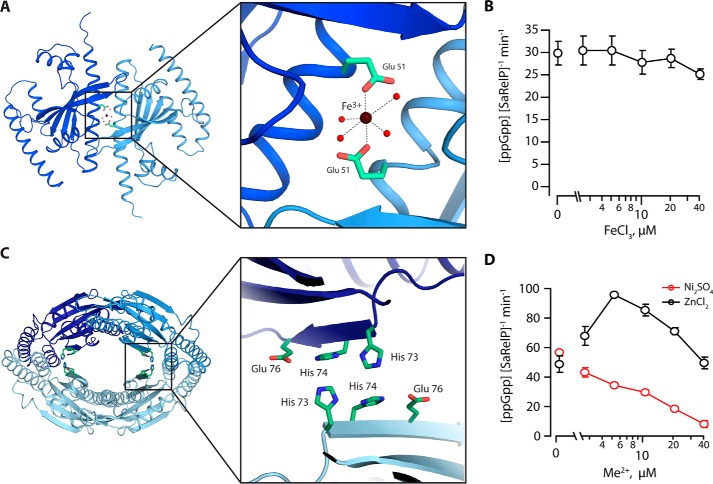
Metal ion ligand–binding sites in SaRelP. A, a top view of the SaRelP dimer shown with Fe3+ bound at the subunit–subunit interface of the dimer and coordinated by the two Glu-51 residues originating from neighboring chains. The inset displays a close-up view with the octahedral coordination of Fe3+ indicated. Fe3+ is shown as a brown sphere, relevant water molecules with red spheres, and the glutamate residues with green sticks. B, enzymatic activity of SaRelP (measured as production of ppGpp from GDP and ATP per enzyme per minute) as a function of increasing FeCl3 concentrations. Assays were performed using 250 nm SaRelP, 200 μm [3H]GDP, and 1 mm ATP. C, a putative second metal-binding site is found at the dimer–dimer interface of the tetramer. The inset shows a close-up view of the region with residues forming the site shown in green sticks. D, enzymatic activity of SaRelP as a function of increasing Ni2SO4 and ZnCl2 concentrations. Error bars represent S.D. of the turnover estimates determined by linear regression. Each experiment was performed at least three times.

