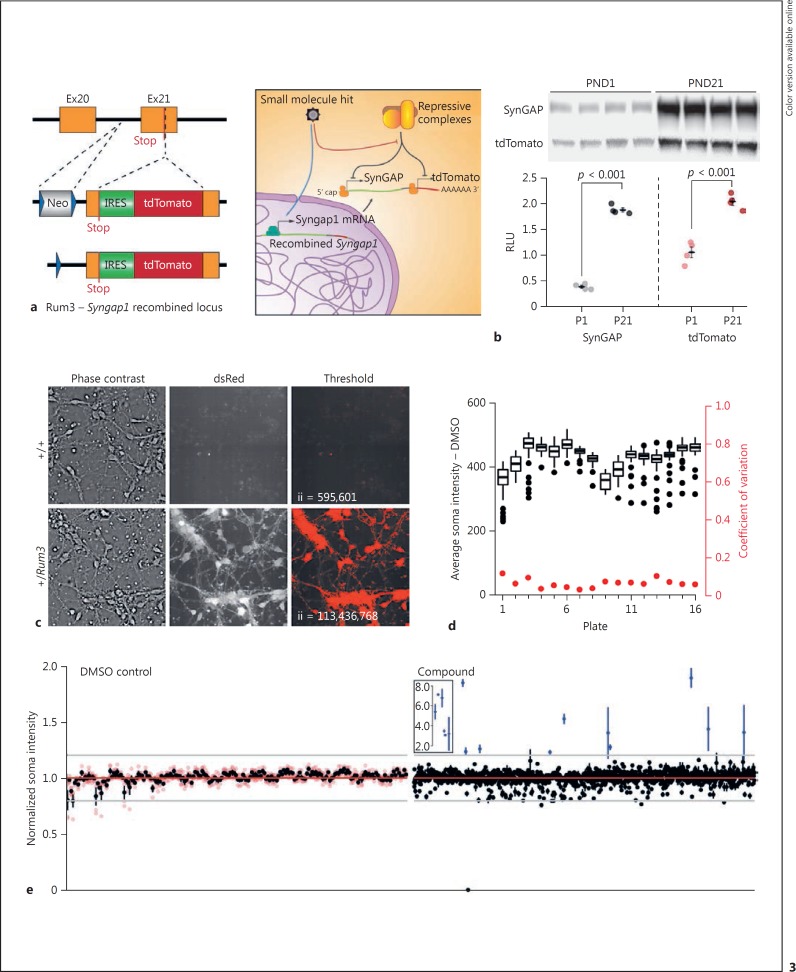
Fig. 3.
Development and validation of an HTS-compatible Syngap1 expression assay. a Schematic representation of the reporter insertion within the mouse Syngap1 locus and expected biology targeted by library molecules to change tdTomato/SynGAP expression levels. b Immunoblots of cortex homogenates from heterozygous Rum3 mice sacrificed at PND1 or PND21. tdTomato and SynGAP expression was normalized to a protein loading control to yield an RLU. The SynGAP groups had equal variance (Levene's test homogeneity of variance: F[1,6] = 0.0487, p = 0.832) and were normally distributed (Shapiro-Wilk test P1 W = 0.869, p = 0.296, and P21 W = 0.831, p = 0.170); statistical analysis was done by unpaired two-sample t test (two-tailed). P1 (n = 4) versus P21 (n = 4) t(6) = −29.614, p < 0.001. The tdTomato groups had equal variance equal (Levene's test homogeneity of variance: F[1,6] = 1.0325, p = 0.3488) and were normally distributed (Shapiro-Wilk test P1 W = 0.934, p = 0.619, and P21 W = 0.986, p = 0.935); statistical analysis was done by unpaired two-sample t test (two-tailed) P1 (n = 4) versus P21 (n = 4) t(6) = −7.78, p < 0.001. c Neurons from PND0 WT or heterozygous Rum3 mice were cultured and imaged at DIV3. A simple intensity threshold was applied to illustrate the high contrast of signal from Rum-positive neurons. ii, integrated intensity of thresholded signal. d Plate-level metrics (soma intensity = black; coefficient of variation of soma intensity = red) from negative control wells across the pilot screen. e Hit plots for individual negative control (left) or compound (right) well locations in the pilot screen; n = 4 wells per data point. Black dots reflect the mean of the four replicates (red dots).

