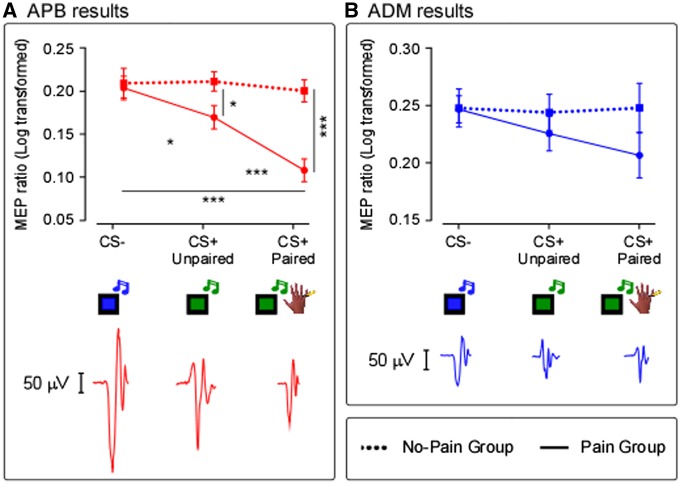
Fig. 3.
Main Experiment, MEPs results. The graph shows for both APB (A) and ADM (B) muscles. The mean MEPs amplitudes, expressed as percentage of the baseline and Log transformed, in the three experimental conditions (CS-; CS+ Unpaired; CS+ Paired) and in the two groups (Pain; No-Pain). Error bars indicate sem. Asterisk indicates a significant comparison (*P < 0.05; **P < 0.005; ***P < 0.0005). Raw MEPs recorded from APB and ADM muscles in one representative subject of the Pain Group are shown.

