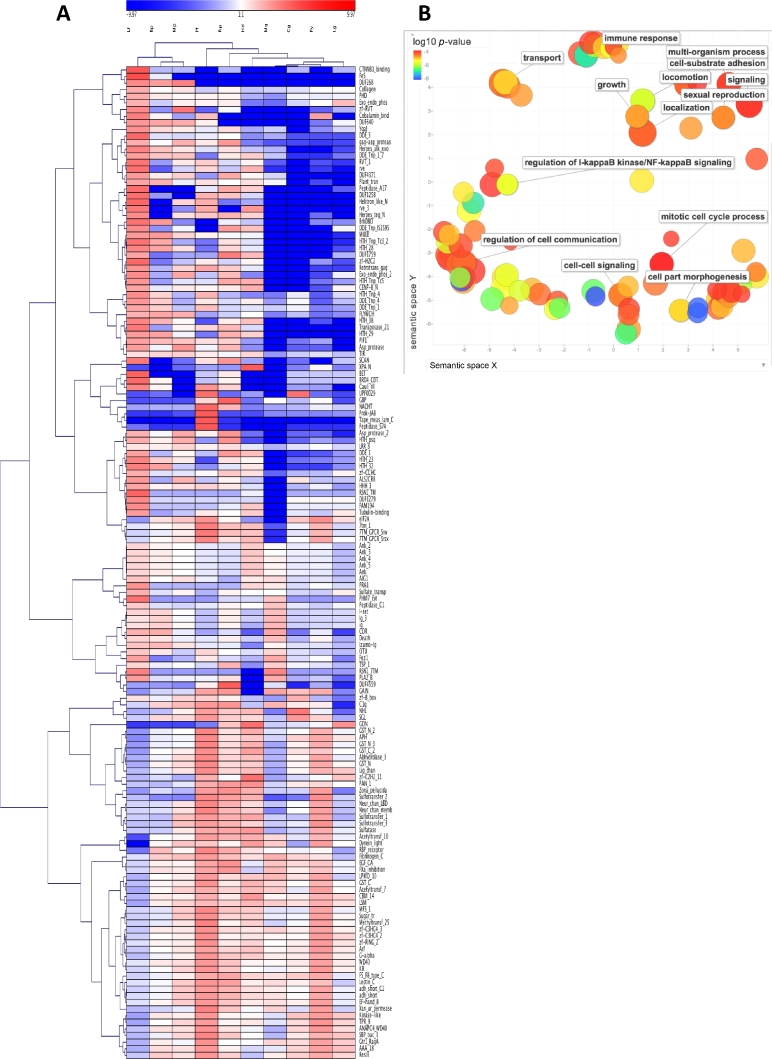
Figure 4:
Gene family representation analysis in the L. fortunei genome. (A) Pfam hierarchical clustering, heatmap. Features were selected according to a model based on the Poisson cumulative distribution of each Pfam count in the golden mussel genome vs the normalized average values found in the other 9 molluscan genomes (Bonferroni correction, P ≤ 0.05). Transposable elements were included in the analysis. Colors depict the log2 ratio between Pfam counts found in each single genome and the corresponding mean values. The hierarchical clustering used the average dot product for the data matrix and complete linkage for branching. Abbreviations: Bp: Bathymodioulus platifrons; Cg: Crassostrea gigas; Hd: Haliotus discus hannai; Lf: L. fortunei; Lg: Lottia gigantean; Mg: Mytilus galloprovincialis; Mp: Modioulus philippinarum; Pf: Pinctada fucata; Py: Patinopecten yessoensis; Rp: Ruditapes philippinarum. (B) Gene Ontology analysis of expanded gene families, semantic scatter plot. Shown are cluster representatives after redundancy reduction in a 2-dimensional space applying multidimensional scaling to a matrix of semantic similarities of GO terms. Color indicates the GO enrichment level (legend in upper left-hand corner); size indicates the relative frequency of each term in the UNIPROT database (larger bubbles represent less specific processes).

