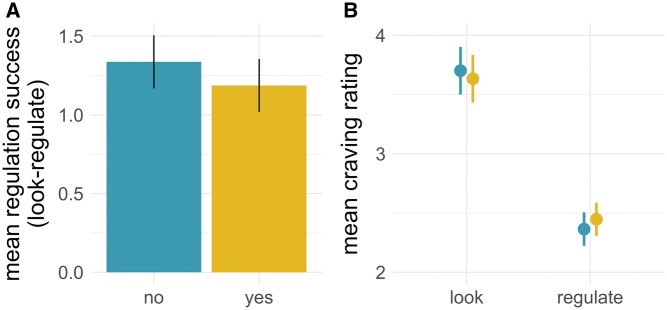
Fig. 3.
Parameter estimates from the multilevel model predicting self-reported craving ratings, plotted as (A) mean regulation success (look − regulate) for no- and yes-choice separately and (B) the interaction between action and choice (blue = no, yellow = yes). Error bars are 95% confidence intervals.

