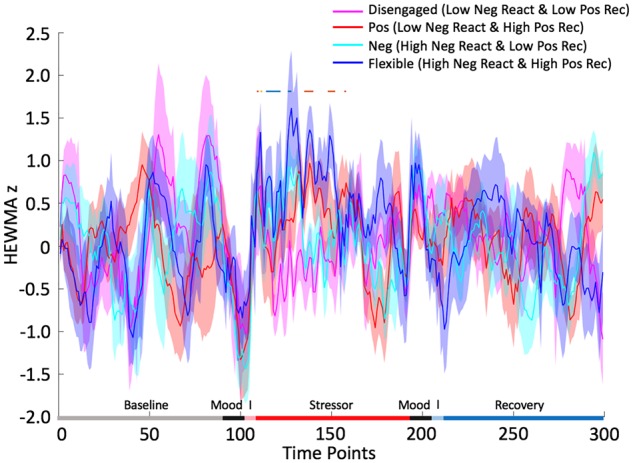
Fig. 6.

Negative emotional stress reactivity (Neg React) and positive emotional recovery (Pos Rec) in the vmPFC ROI. Horizontal bars above the line plot highlight the time points that there were significant between group differences in cluster activation. ‘I’ refers to the instructions from the following tasks. Blue bar suggests high Neg React group had greater activation than low Neg React group, orange suggests high Pos Rec group had greater activation than low Pos Rec group and yellow suggests the combination of blue and orange bars.
