FIGURE 2.

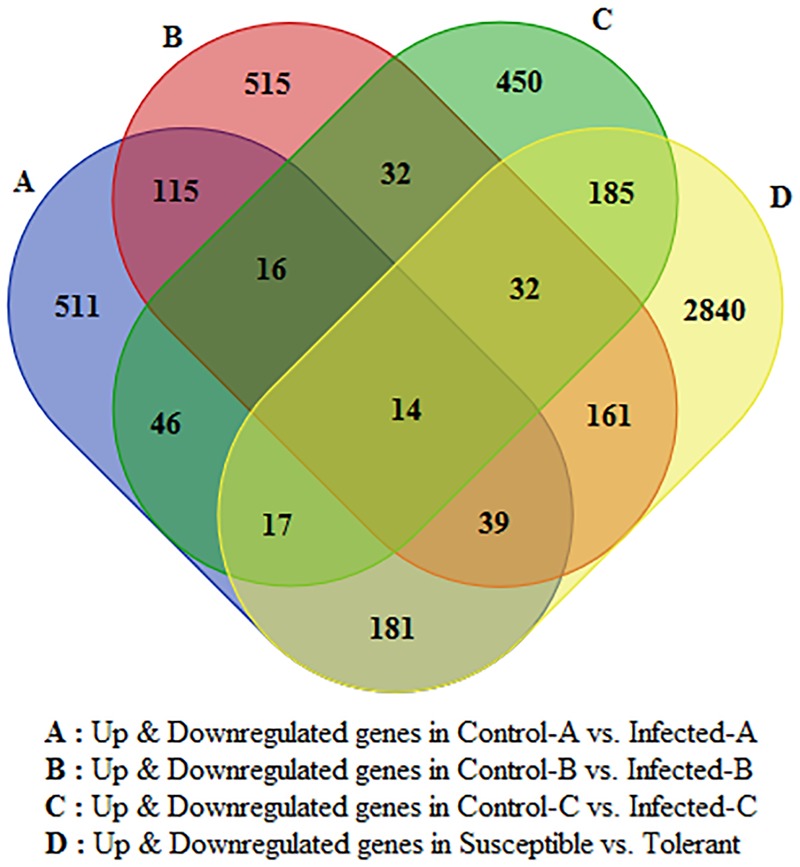
Venn diagram indicating number of HLB-regulated genes commonly modulated between the four datasets and specifically induced by HLB in each of the four RNA-Seq datasets.

Venn diagram indicating number of HLB-regulated genes commonly modulated between the four datasets and specifically induced by HLB in each of the four RNA-Seq datasets.