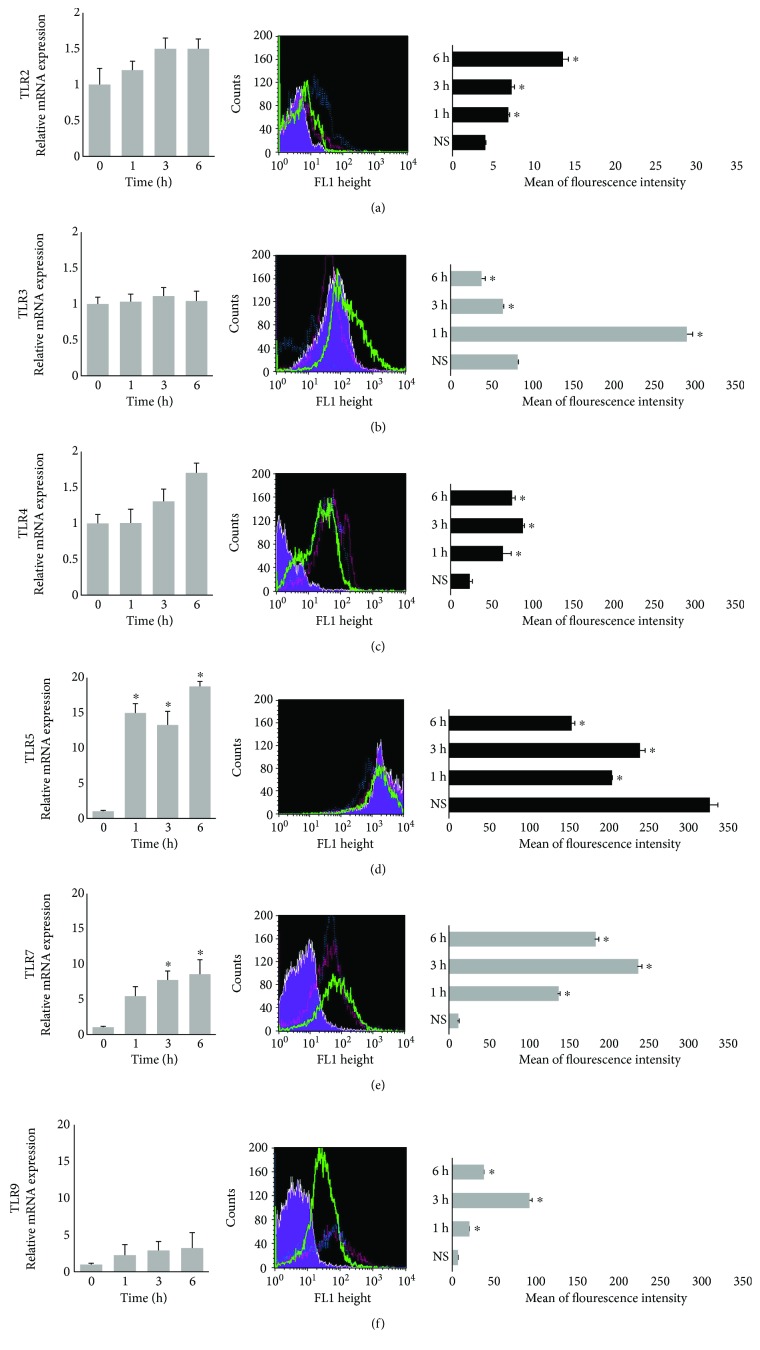
Figure 1.
mRNA and protein levels of (a) TLR2, (b) TLR3, (c) TLR4, (d) TLR5, (e) TLR7, and (f) TLR9 in resting and LL-37-stimulated mast cells. Mast cells were incubated with LL-37 at a final concentration of 1 μg/mL or medium alone (nonstimulated (NS)) for 1 h, 3 h, or 6 h. Left panel: TLR mRNAs expression was assessed using qRT-PCR. The expression of receptor mRNAs was corrected by normalization based on the transcript level of the housekeeping gene rat Actb. Results are the mean ± SD of three experiments performed in duplicate (n = 6). Middle panel: TLR protein expression assessed by flow cytometry. The results shown are representative of three independent experiments. Shaded tracings: TLRs expression in nonstimulated cells; open tracings: TLRs expression in cells after LL-37 stimulation for 1 h (green), 3 h (red), and 6 h (violet). Right panel: flow cytometry analysis of surface (s) TLR2, intracellular (i) TLR3, sTLR4, sTLR5, iTLR7, and iTLR9 expression. The data represent the mean of fluorescent intensity ± SD of three experiments performed in duplicate (n = 6). Comparisons between groups were carried out by using Student's t-test for small groups. Differences were considered significant at P < 0.05 and are labeled with an asterisk (∗) on each graph.

