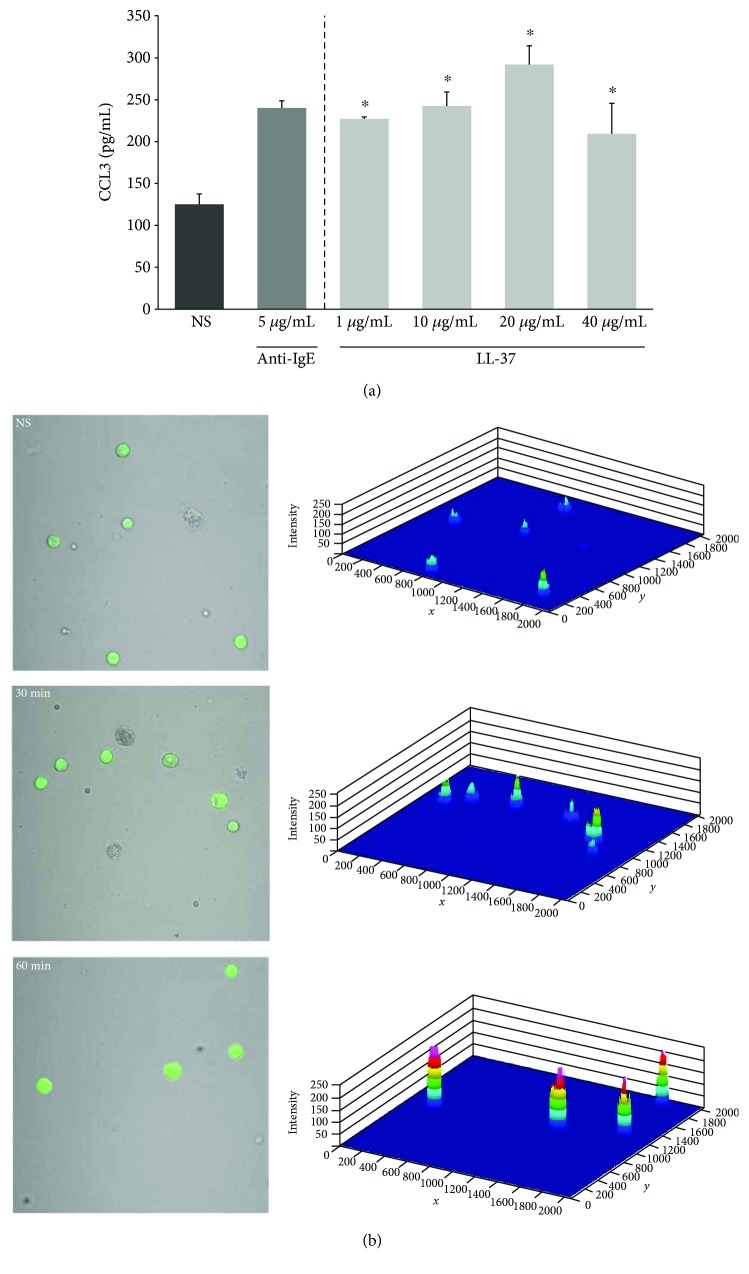
Figure 8.
Effect of LL-37 on (a) CCL3 and (b) ROS production. For CCL3 measurement, mast cells were incubated with different concentrations of LL-37, anti-IgE at 5 μg/mL (positive control), or medium alone (NS) for 2 h. Results are the mean ± SD of four independent experiments (n = 8). Comparisons between groups were carried out by using Student's t-test for small groups. Differences were considered significant at P < 0.05 and are labeled with an asterisk (∗) on each graph. To evaluate ROS generation, mast cells were incubated with 1 μg/mL LL-37 for 30 or 60 min or medium alone (NS). Indicator for ROS, H2DCFDA, was used at a concentration of 2 μM for 10 min.

