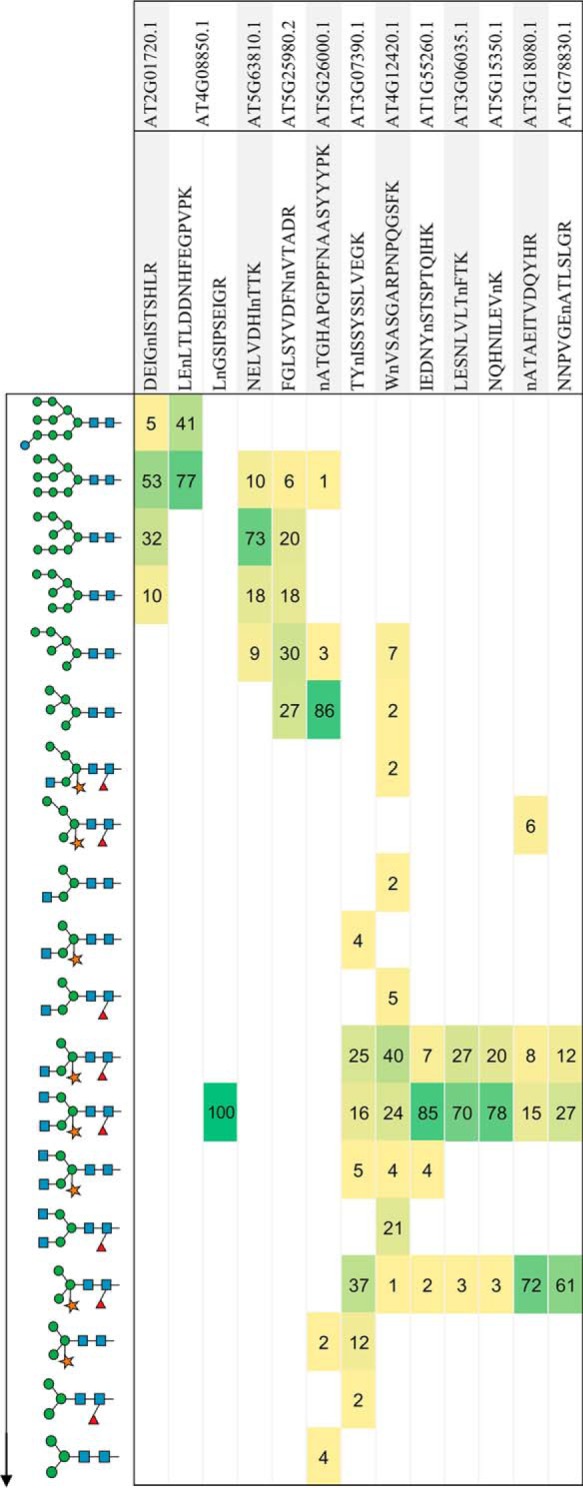
Fig. 2.

Heatmap highlighting N-glycan heterogeneity of N-glycopeptides. A range of N-glycopeptides were manually selected to highlight the structural heterogeneity patterns observed in glycoproteins from wild-type rosette (n = 6). A proportion was calculated from the area of the XIC for each N-glycan structure for a given glycopeptide for each experiment and then averaged. These patterns highlight a prominent structural class for a given glycopeptide, for example, immature, high-mannose, complex and paucimannose. Structures are shown in a generalized linear sequence representing the maturation of the N-glycan structure in plants (top to bottom).
