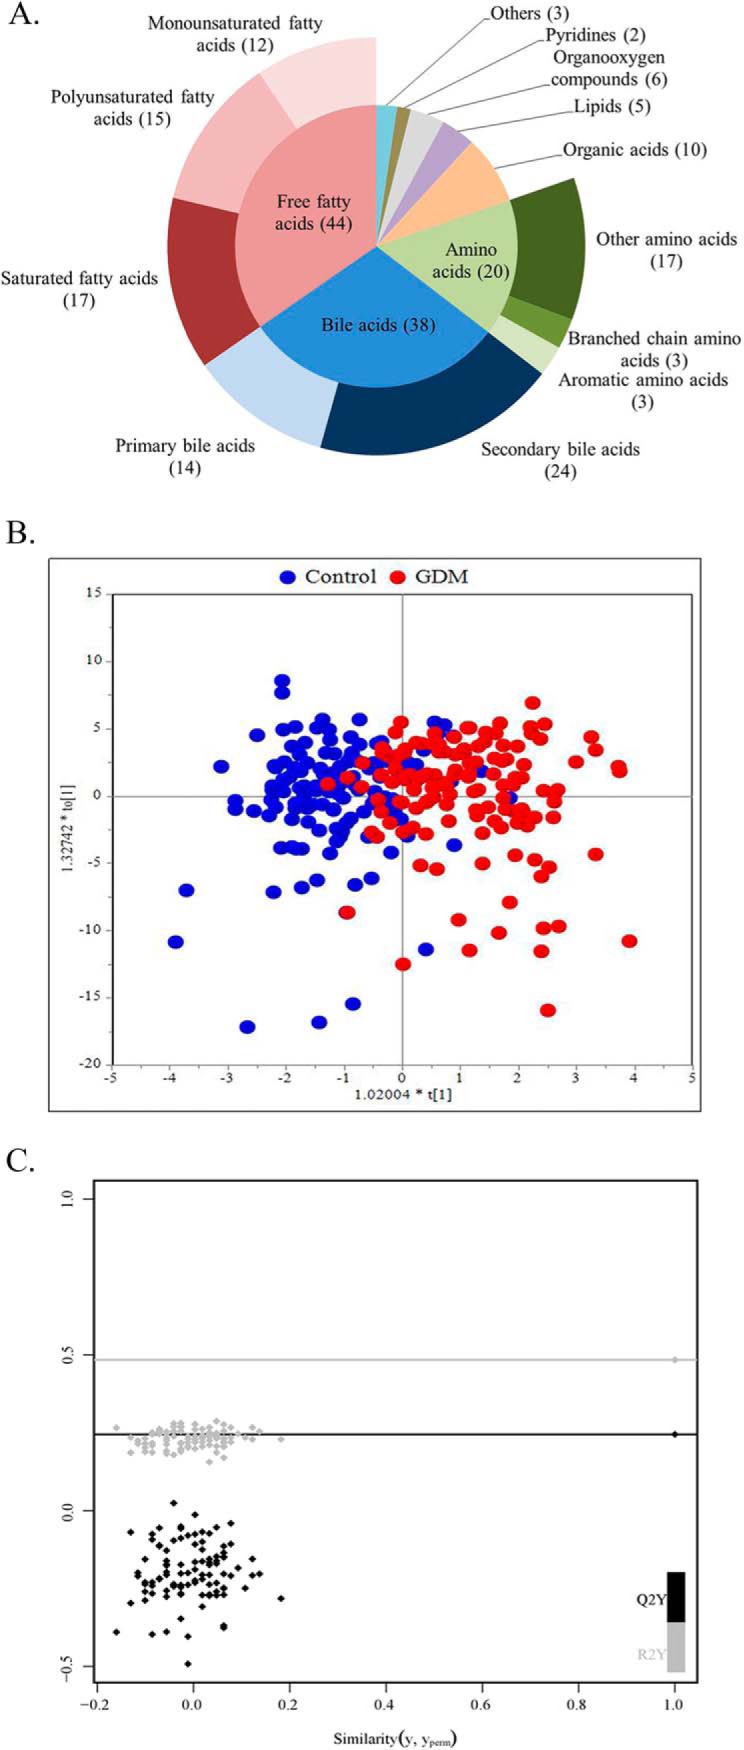
Fig. 1.

Metabolite types and the scores plot of the OPLS-DA model. A, Pie chart displays 6 metabolite types and subtypes measured in our research. Free fatty acids (red) include12 monounsaturated fatty acids, 15 polyunsaturated fatty acids and 17 saturated fatty acids; bile acids (blue) include 14 primary bile acids and 24 secondary bile acids; amino acids (green) include 3 branched chain amino acids, 3 aromatic amino acids and other 17 amino acids. B, The OPLS-DA scores plot shows the groupings of control (blue), and GDM (red) subjects based on all metabolite profiles. R2X = 0.314, R2Y = 0.543, Q2 = 0.254. C, The permutation test for the OPLS-DA model. Permutated R2 = 0.01, permutated Q2 = 0.01.
