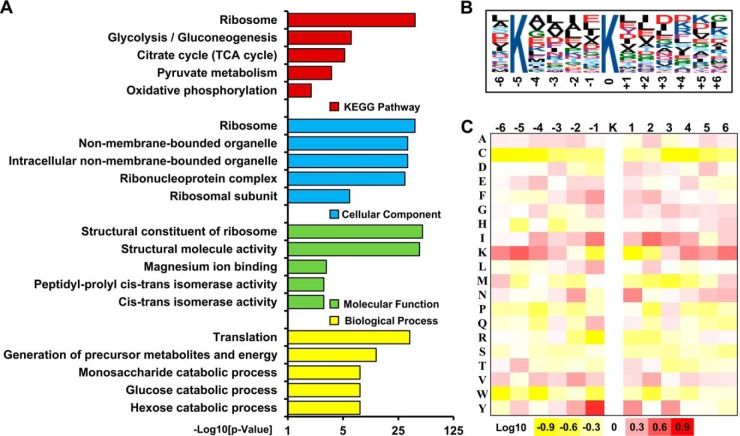
Fig. 2.
Enrichment analysis of succinylated proteins and bioinformatics analysis of succinylation sites. A, Histogram representations of the enrichment of identified succinylated proteins for biological processes, molecular functions, cellular components and KEGG pathways. The enrichment of GO categories, pathway and domain were performed using DAVID bioinformatics tools (p < 0.05). B, Motif-X analysis of the succinylated sites. The motifs with significance of p < 0.000001 are shown. C, Heat map showing sequence motifs of lysine-succinylated sites. The intensity map shows the relative abundance for ± 6 amino acids from the lysine-succinylated site. The colors in the intensity map represent the log10 of the ratio of frequencies within succinyl-13-mers versus non-succinyl-13-mers (red shows enrichment, yellow shows depletion).

