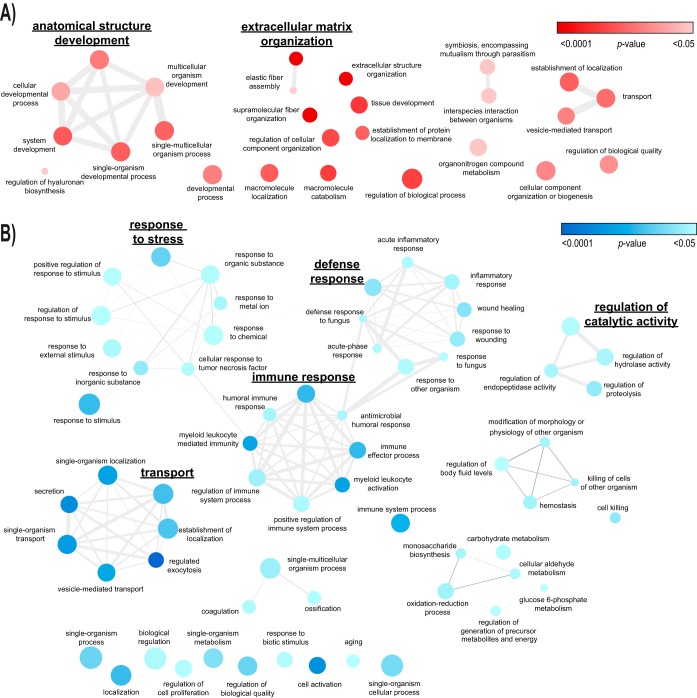
Fig. 4.
Biological process enrichment maps of top-differentially ranked proteins in PD effluent versus plasma. A, clusters of biological processes enriched in 100 most extreme proteins with higher abundance in PD effluent (PDE) than in the human plasma protein database (HPPDB). B, clusters of biological processes enriched in 100 most extreme proteins with lower abundance in PDE than in the HPPDB. node color intensity: p value overrepresentation test (Panther database; Bonferroni-corrected p < 0.05), node size: proportional to prevalence of the term in the GO database (homo sapiens - all genes, ReviGO), edge width: degree of similarity (ReviGO) (Full list see supplemental Table S7).

