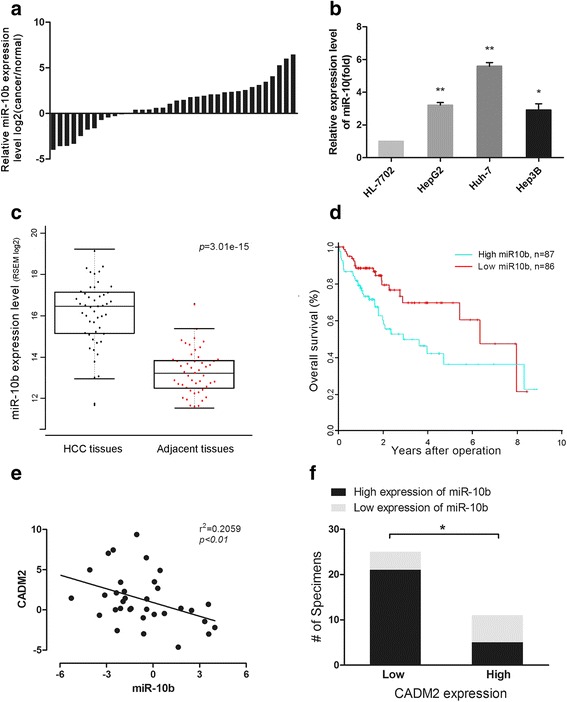
Fig. 5.

Correlation between CADM2 and miR-10b in human HCC samples. a Relative miR-10b expression levels in HCC samples. b qRT-PCR for detecting miR-10b expression levels in several HCC cell lines and normal liver cell line as indicted. c The expression of miR-10b in cancerous tissues and matched normal tissues from TCGA (P = 3.01e-15). d Kaplan-Meier analysis of over-all survival of patients with different miR-10b expression level (P = 0.0127). e The Spearman’s correlation analysis between miR-10b expression and CADM2 expression in HCC samples (P = 0.0054). f The relationship between miR-10b expression and CADM2 protein expression was analyzed using Fisher exact test (P = 0.039). Data represents mean ± SEM of three independent experiments. Error bars represent SD. (*P < 0.05; **P < 0.01)
