Fig. 3.

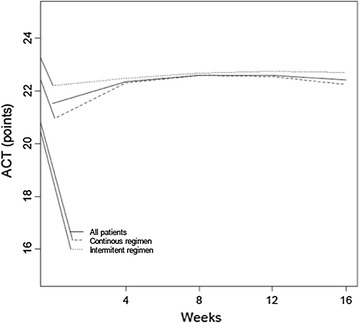
Curve fitting for ACT/cACT scores from randomization to the end of the follow up of all (continuous line), intermittent (dotted line) and continuous (dashed line) participants.

Curve fitting for ACT/cACT scores from randomization to the end of the follow up of all (continuous line), intermittent (dotted line) and continuous (dashed line) participants.