
Fig. 4.
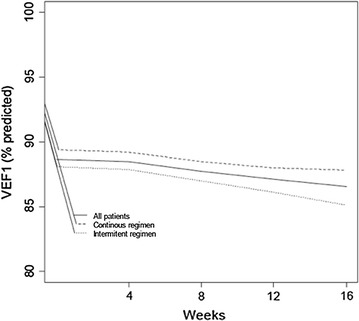
Curve fitting for FEV1 (% predicted) from randomization to the end of the follow up of all (continuous line), intermittent (dotted line) and continuous (dashed line) participants
Official websites use .gov
A
.gov website belongs to an official
government organization in the United States.
Secure .gov websites use HTTPS
A lock (
) or https:// means you've safely
connected to the .gov website. Share sensitive
information only on official, secure websites.
Curve fitting for FEV1 (% predicted) from randomization to the end of the follow up of all (continuous line), intermittent (dotted line) and continuous (dashed line) participants