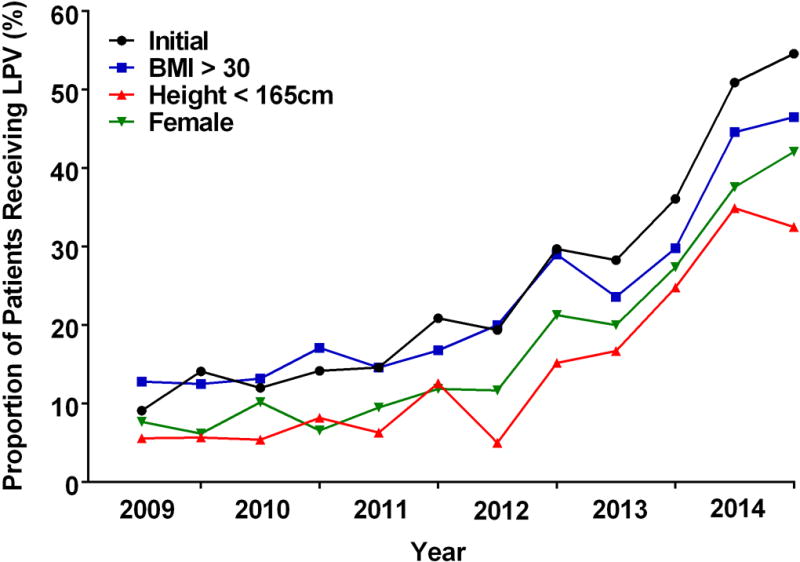
Figure 3.

The proportion of patients receiving lung protective ventilation (VT ≤ 6 ml/kg PBW and PEEP ≥ 5 cm H2O) during 1LV for the study cohort and subpopulations during a 10 minute epoch beginning 5 minutes after the start of 1LV plotted at six month intervals. VT = tidal volume; PBW = predicted body weight; PEEP = positive end expiratory pressure; 1LV = one lung ventilation.
