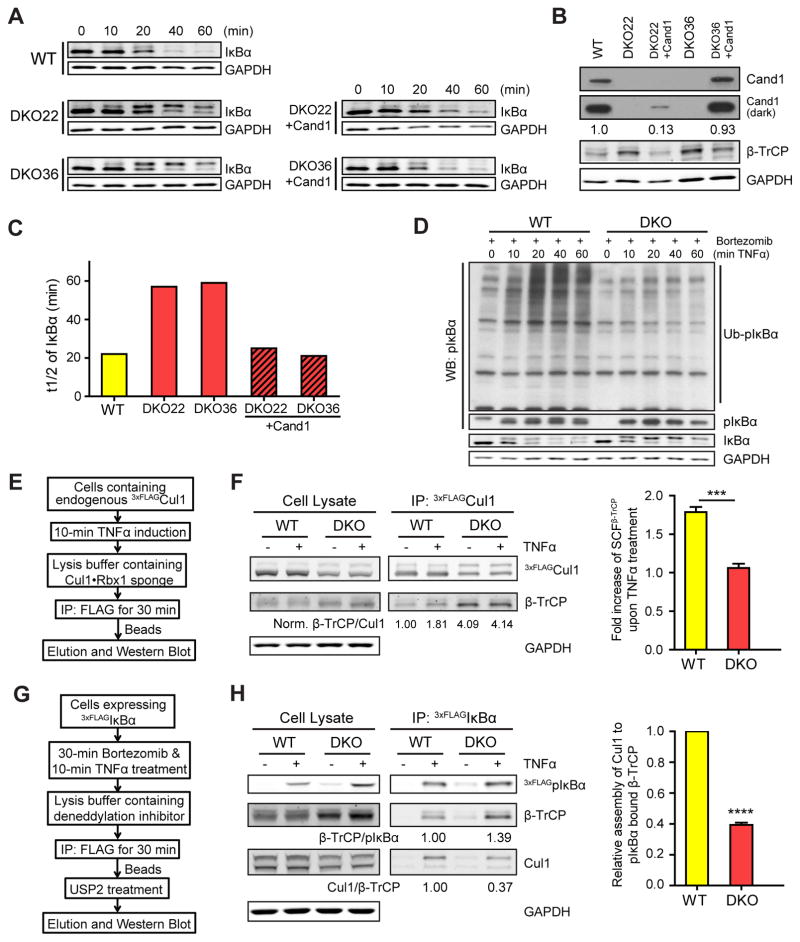
Figure 2. Cand1/2 double knockout (DKO) cells display defects in IκBα degradation and SCFβ-TrCP assembly.
(A–C) Cand1/2 DKO cells display defects in IκBα degradation. IκBα levels in indicated cell lines were monitored by western blot (WB) at indicated time points after TNFα treatment. Both phospho-IκBα (pIκBα, upper band) and unmodified IκBα (lower band) were detected by the anti-IκBα antibody. Here and elsewhere in this work, we blotted for GAPDH as a loading control.
(B) WB analysis of Cand1 and β-TrCP in cell lysates from (A). A more intense exposure (dark) of the Cand1 blot and relative levels of Cand1 are also shown.
(C) Quantification of IκBα t1/2 from panel A.
(D) Ubiquitination of pIκBα is significantly reduced in DKO cells. WB analysis (with anti-pIκBα antibody) of the ubiquitination of pIκBα in WT and DKO cells upon TNFα treatment. DKO36 from (A) was used in this experiment and thereafter.
(E–F) TNFα promotes formation of SCFβ-TrCP in WT but not DKO cells. Schematic workflow of the experiment is depicted in (E), and WB analysis of endogenous SCFβ-TrCP in WT and DKO cells before and after 10-min TNFα treatment is shown in (F). Relative levels of SCFβ-TrCP were calculated as the β-TrCP:Cul1 ratio in 3xFLAGCul1 immunoprecipitations (IPs), and all ratios were normalized to that obtained for the IP from WT cells not treated with TNFα. Average fold increase of SCFβ-TrCP induced by TNFα treatment is shown in the graph. Error bars, ± SEM, n = 3, P value = 0.001.
(G–H) Recruitment of Cul1 to pIκBα•β-TrCP is inefficient in DKO cells. Schematic workflow of the experiment is depicted in (G), and WB analysis of the recruitment of β-TrCP and Cul1 to pIκBα following 10-min TNFα treatment is shown in (H). Expression of 3xFLAGIκBα was induced by 100 ng/ml tetracycline for 24 hours. Relative levels of β-TrCP and Cul1 recruited to pIκBα were calculated as the β-TrCP:pIκBα (see also Fig S2I) and Cul1:β-TrCP ratios in the IPs. Average levels of Cul1 recruited to pIκBα•β-TrCP are shown in the graph. Error bars, ± SEM, n = 3, P value = 0.0001.

