Figure 1.

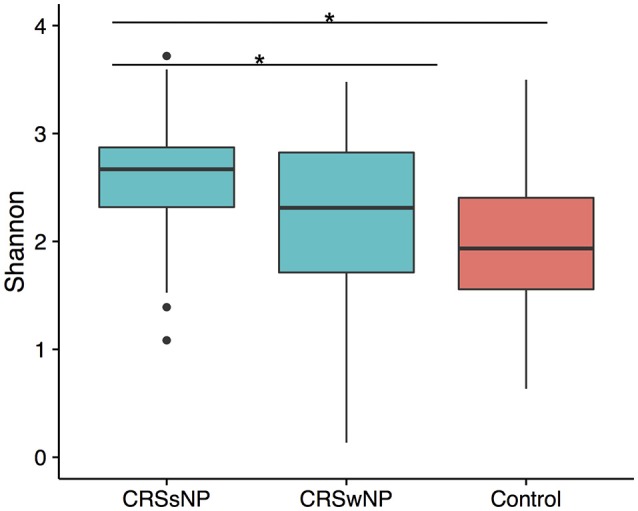
Boxplot of Shannon diversity. (A) Diversity in sinus cavities from CRS subjects separated by the absence (CRSsNP) or presence (CRSwNP) of nasal polyps and control subjects. Significant differences indicated by * (ANOVA, p < 0.05).

Boxplot of Shannon diversity. (A) Diversity in sinus cavities from CRS subjects separated by the absence (CRSsNP) or presence (CRSwNP) of nasal polyps and control subjects. Significant differences indicated by * (ANOVA, p < 0.05).