
Figure 1.
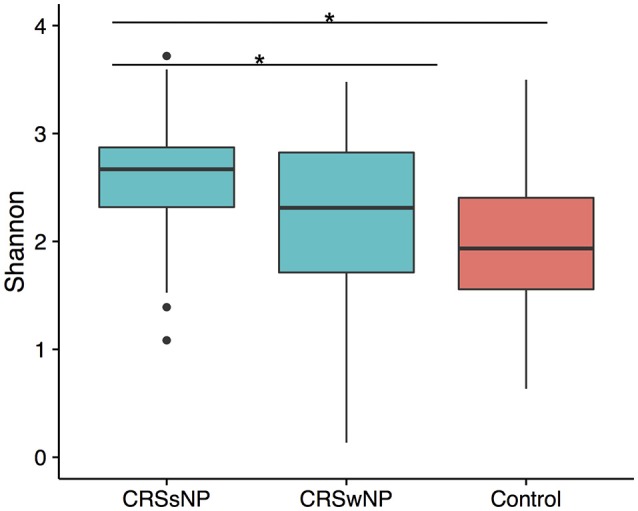
Boxplot of Shannon diversity. (A) Diversity in sinus cavities from CRS subjects separated by the absence (CRSsNP) or presence (CRSwNP) of nasal polyps and control subjects. Significant differences indicated by * (ANOVA, p < 0.05).
Official websites use .gov
A
.gov website belongs to an official
government organization in the United States.
Secure .gov websites use HTTPS
A lock (
) or https:// means you've safely
connected to the .gov website. Share sensitive
information only on official, secure websites.
Boxplot of Shannon diversity. (A) Diversity in sinus cavities from CRS subjects separated by the absence (CRSsNP) or presence (CRSwNP) of nasal polyps and control subjects. Significant differences indicated by * (ANOVA, p < 0.05).