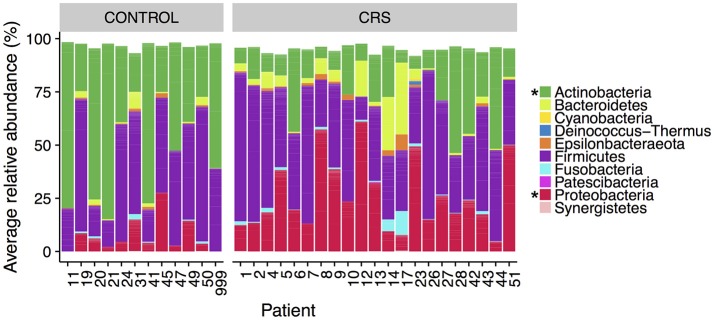
Figure 3.
Average relative abundance of phyla in CRS and control subjects. Values are averages across all sinus samples per patient. Percentages were calculated from rarefied data. Phyla that were significantly different in relative abundance between CRS and controls are marked with * (Kruskal-Wallis, FDR corrected p < 0.05).

