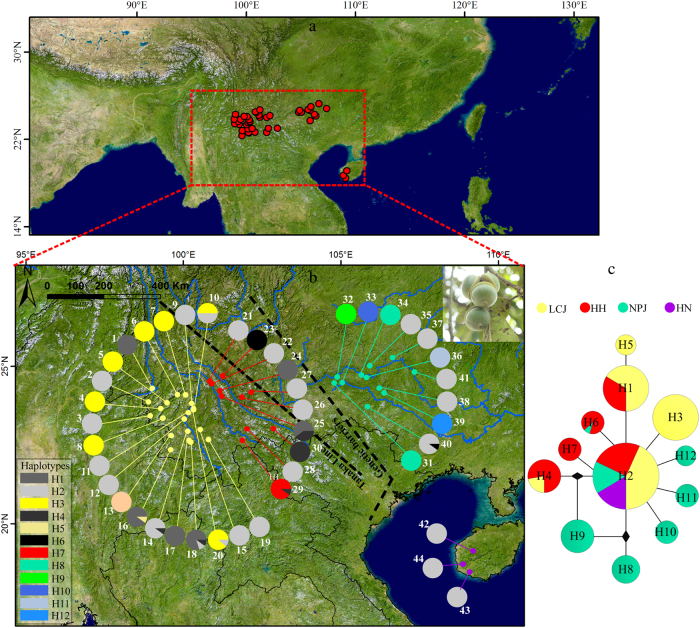
Fig. 1.
a The distribution area of this studies. b Geographic distribution and c network of 12 cpDNA haplotypes of Quercus kerrii. b The pie charts reflect the occurrence frequency of each haplotype in each population. Haplotype colours correspond to those shown in the lower-left panel. The two dotted lines represent the Tanaka line and species genetic barriers, respectively. c The circle sizes are in proportion to the number of individuals of each haplotype. Haplotypes are coloured yellow, red, green and violet to represent the populations belonging to groups LCJ, HH, NPJ and HN, respectively

