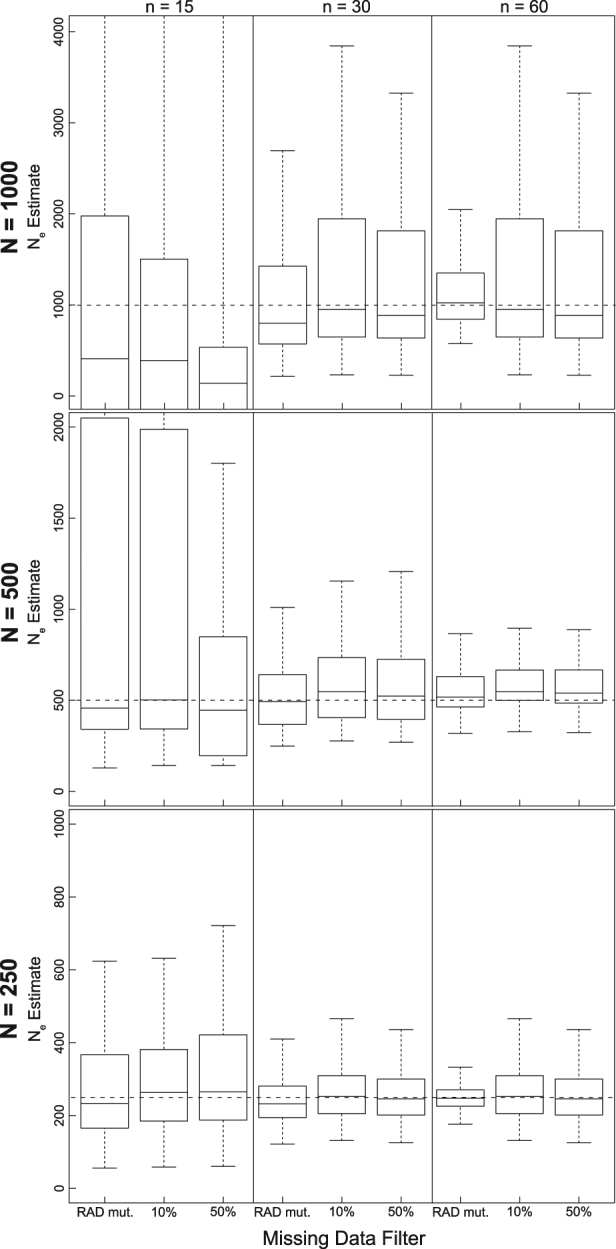
Fig. 1.

Boxplots of the distribution of  estimates from 100 replicate simulations for LD-based estimation at generation 20 from temporal simulations under stable population sizes (λ = 1.0) with a P
crit = 0.05. Dashed lines represent true N
e for the three population size models (1000, 500, and 250). Different missing data-filtering strategies are shown at the bottom of the figure. The number of individuals sampled is shown at the top
