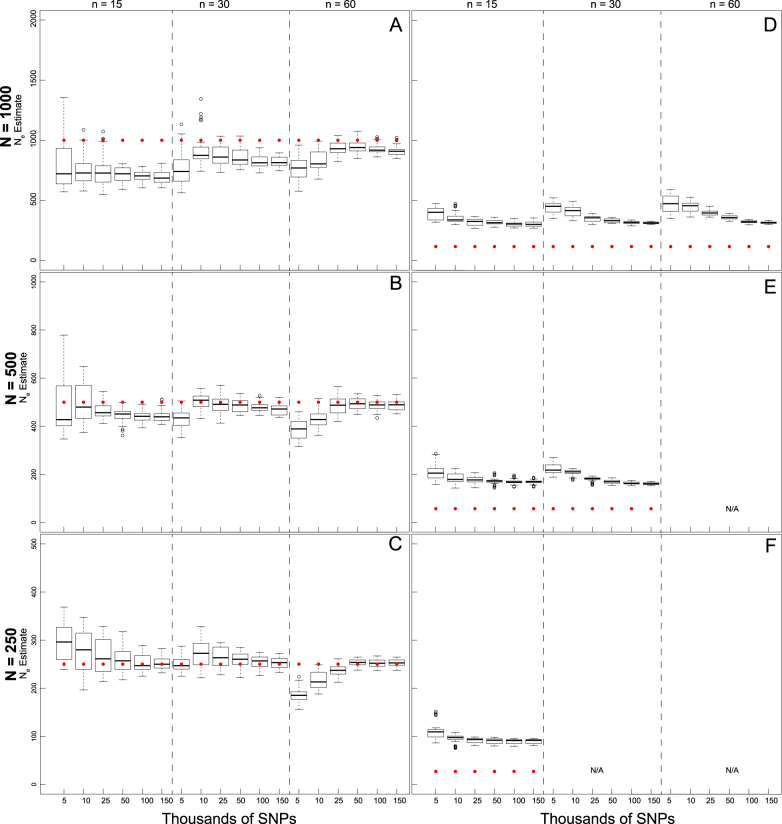
Fig. 2.
Boxplots of the distribution of fastsimcoal2 estimates of  at t
20 from 40 replicate temporal simulations. a–c
 estimates under a stable population size (λ = 1.0) for population sizes of (a) 1000, (b) 500, and (c) 250. d–f
 estimates under declining population size (λ = 0.9), for initial population size of (d) 1000, (e) 500, and (f) 250. Red dots represent the true N
e at t
20. Results are broken down across the number of individuals sampled (identified at the top of each panel) and the different numbers of SNPs used in analysis (identified at the bottom of each panel). For some parameter combinations, there were insufficient numbers of individuals for target n

