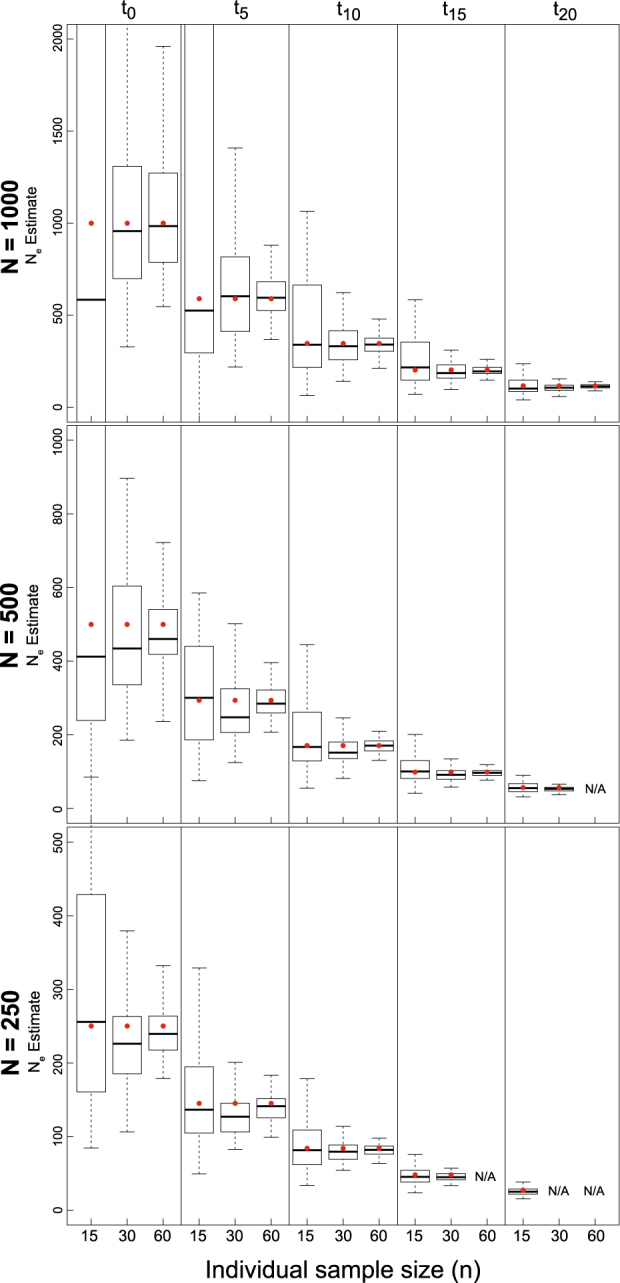
Fig. 3.

Boxplots of the distribution of point estimates from 100 replicate simulations for LD-based N e estimation from five temporal sampling points (t 0–t 20) under declining population growth model (λ = 0.9) using the 10% missing data set and a P crit = 0.05. Red dots represent true N e over time, starting from an initial N of 1000 (top), 500 (middle), or 250 (bottom). Results are also broken down across different levels of individual sample size (n = 15, 30, or 60). For some parameter combinations, there were insufficient numbers of individuals for target n
