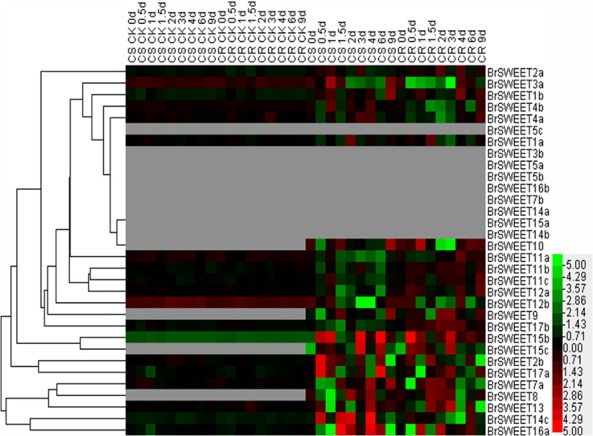
FIGURE 7.

Expression patterns of the SWEET genes in the leaves of Chinese cabbage after infection of P. brassicae. Hierarchical clustering and heatmap representation show time course responses of SWEET gene expressions in the leaves of Chinese cabbage after P. brassicae infection. The expression levels of genes are presented using fold-change values transformed to Log2 format. The data obtained by quantitative RT-PCR correspond to the levels of SWEETs in total RNA samples extracted from leaves before and after infection of P. Brassicae. The data indicate the relative expression levels normalized to that of the internal control Actin or 18srRNA. Gray color means no signal detected, while red and green colors correspond to up- and down-regulation of the SWEET gene expressions, respectively.
