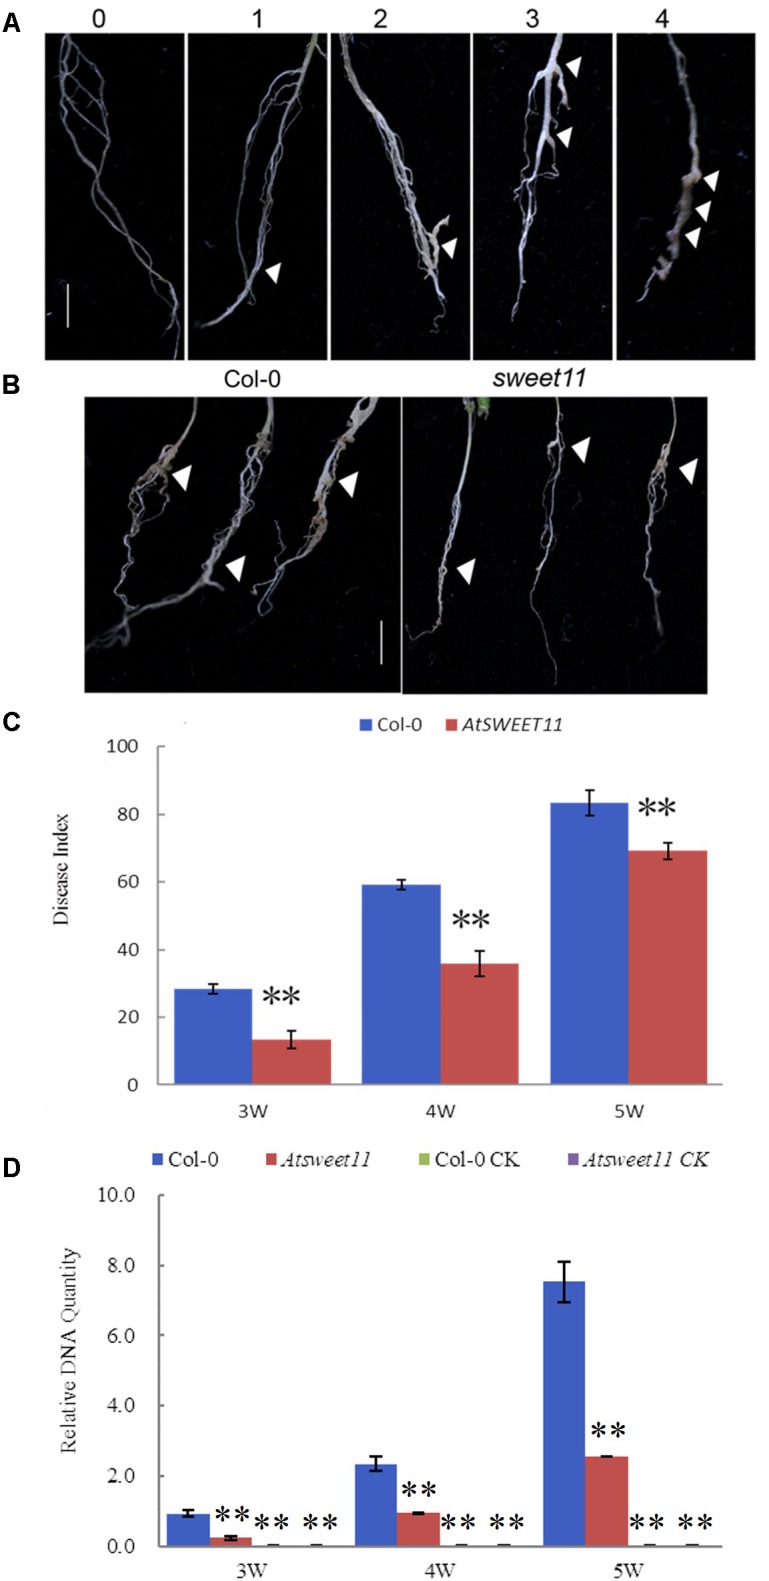
FIGURE 8.

The disease index (DI) of clubroot development in A. thaliana after inoculation with P. brassicae. (A) Disease symptoms were scored as the follows: 0, no symptoms; 1, a few small clubs on the lateral roots; 2, larger clubs on the lateral roots; 3, swelling of the main roots; 4, severe galling of tissues of both lateral and main roots. (B) The root morphology of the sweet11 mutant (sweet11) and the corresponding wild-type plants (Col-0) after infection of P. brassicae. Arrows point to the position of gall formation. (C) The disease index (DI) was calculated according to the formula DI = [nw] × 100/4T, where n is the number of plants in each class, w is disease symptoms (0–4), and T is the total number of plants tested. Data were collected during an infection time course at 3, 4, and 5 weeks post inoculation. Significant differences between the wild-type (Col-0) and the sweet11 mutant are indicated by asterisks (P < 0.01). (D) The relative pathogen DNA content of the sweet11 mutant (sweet11) and the corresponding wild-type plants (Col-0) after infection of P. brassicae. Horizontal axis is time point after P. brassicae inoculation. Vertical axis is the relative DNA quantities. Col-0 CK and Atsweet11 CK represent the relative DNA quantities of Arabidopsis wild type and mutant without P. brassicae infection as control.
