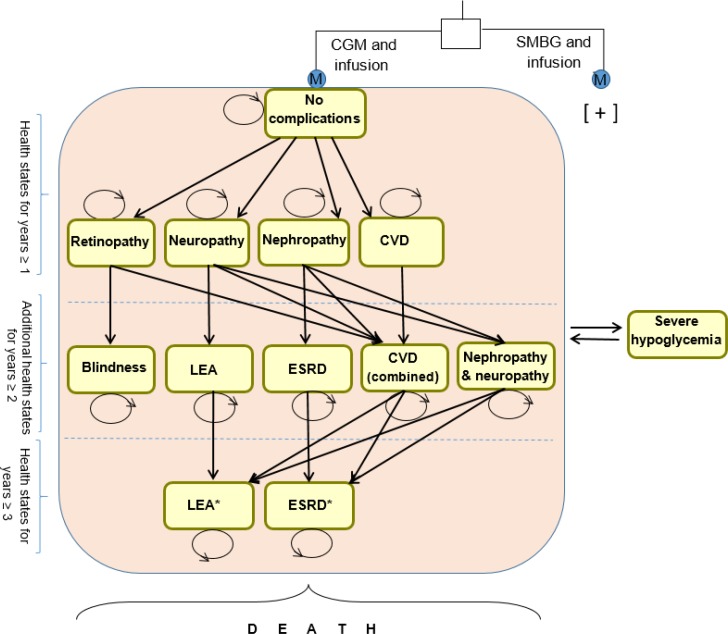
Figure 4: Continuous Glucose Monitoring Versus Self-Monitoring of Blood Glucose—Long-Term Markov Model of Complications in Patients With Type 1 Diabetesa.
Abbreviations: CGM, continuous glucose monitoring; CVD, cardiovascular disease, ESRD, end-stage renal disease; LEA, lower-extremity amputation; SMBG, self-monitoring of blood glucose.
aStraight arrows represent progression to a severe health state; curved arrows represent remaining in the same health state; straight arrows to and from severe hypoglycemia represent the probability of having a hypoglycemic event in any health state. All health states except no complications, retinopathy, neuropathy, and blindness had excess mortality. Infusion includes multiple daily injections or insulin pump. The model structure was adopted from McQueen et al.51
*Combined health states.

